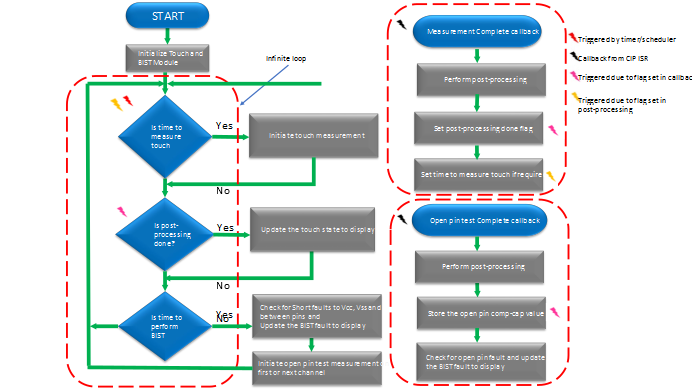
The following diagram shows the application flow with touch measurement performed at regular intervals. At the end of each measurement, the data is processed to find touch states; depending on the touch states, the LEDs are updated.
Figure 1. BIST Flow Diagram