The following instructions show how to analyze power consumption using the Power Debugger and Data Visualizer.
Notes:
- For detailed information on the Power Debugger, refer to the Power Debugger User’s Guide.
- For detailed information on the Data Visualizer, refer to the Data Visualizer User’s Guide.
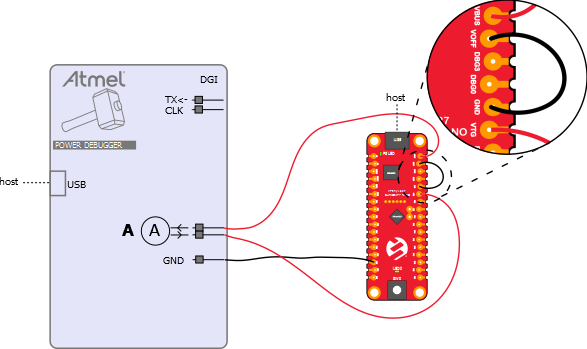
Power Debugger connection:
- 1.Connect one of the ground reference pins of the Power Debugger to a ground pin on the Curiosity Nano board.
- 2.Connect the VOFF pin on the Curiosity Nano board to a ground pin to turn off the connection between the USB power supply and the tinyAVR device.
- 3.Connect the VBUS pin on the Curiosity Nano board to the the input current pin of measurement circuit A on the Power Debugger.
- 4.Connect the output current pin of measurement circuit A on the Power Debugger to the VTG pin on the Curiosity Nano board.
Figure 1. Power Debugger Connection
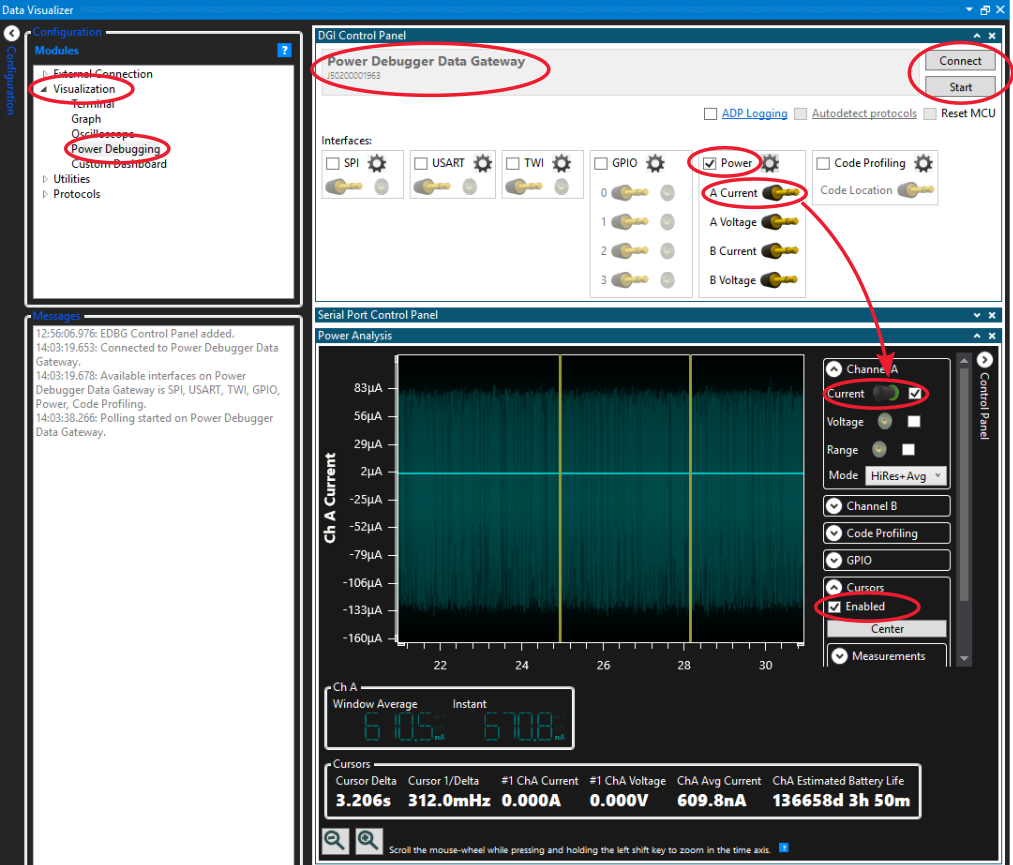
Data Visualizer setup:
- 1.Open Data Visualizer.
- 2.Open in Data Visualizer.
- 3.On the DGI Control Panel pane, select .
- 4.Check the Power check box.
- 5.Expand the Channel A dropdown in the Control Panel in the Power Analysis pane.
- 6.Drag the plug from A Current in the DGI Control Panel pane to the Current socket in the Power Analysis pane.
- 7.Press in the DGI Control Panel pane.
- 8.Optional: Enable cursors by checking the Enabled check box in the Cursors dropdown.
Figure 2. Power Debugging Graph in Data Visualizer