The following figures illustrate the details on the retransmission cycle and highlights on the consumption values for one retransmission cycle. The following table provides details about the settings for profiling the retransmission scenario in the WLR089 device.
|
Attribute |
Value |
|---|---|
|
TX Data Rate |
DR0 and DR5 |
|
RX1 delay |
1s (considered from end of TX) |
|
RX1 data rate |
Same as TX data rate |
|
RX2 delay |
2s (considered from end of TX) |
|
RX2 data rate |
DR0 |
|
Number of retransmissions (retx) |
2 |
|
TX power(1) |
1 (default) |
|
Note:
|
|
To perform this scenario, disable the RX1 and RX2 receive windows on the network server side to restrict the ack reception in the WLR089 device receive windows, and the MLS proceeds to perform the retransmission cycle.
The following table provides the plot reference that signifies the scenario and MAC state at that instance inside all the data retransmission plots.
| Scenario | MAC_STATE | |
|---|---|---|
| A | Transmission of uplink | TX_OCCURING |
| B | RX1 delay | BEFORE_RX1 |
| C | RX1 receive window | RX1_OPEN |
| D | RX2 delay | BETWEEN_RX1_RX2 |
| E | RX2 receive window open | RX2_OPEN |
| F | Retransmission delay | RETRANSMISSION_DELAY |
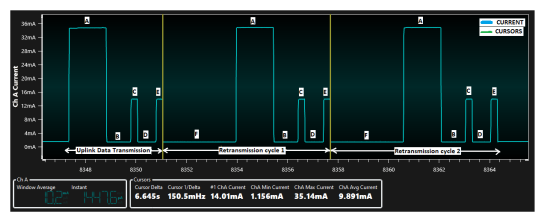
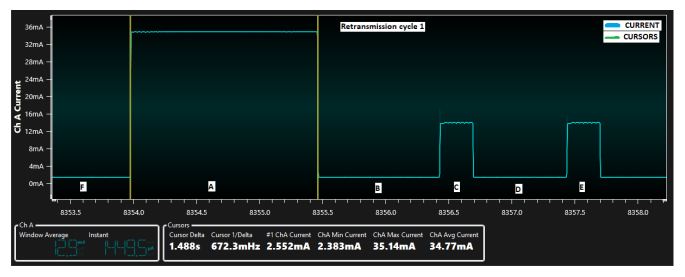
The following figure illustrates the data retransmission with time delta on one retransmission cycle at DR0.
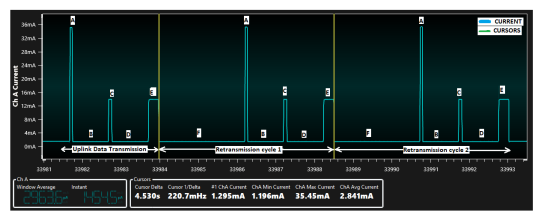
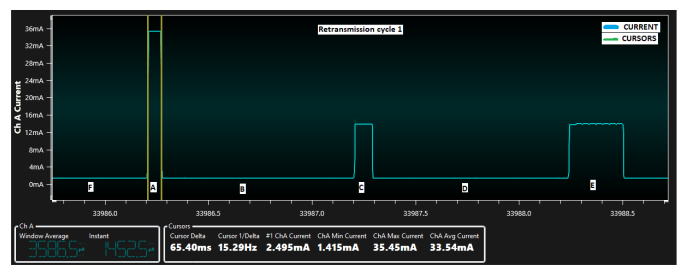
The following figure illustrates the data retransmission with time delta on one retransmission cycle at DR5.
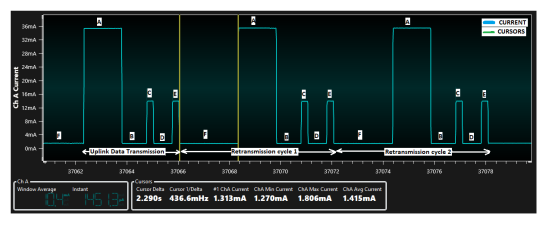
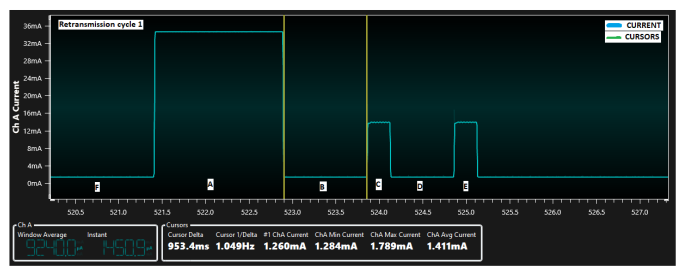
The following figure illustrates the data retransmission with time delta on the retransmission delay slot at DR0.
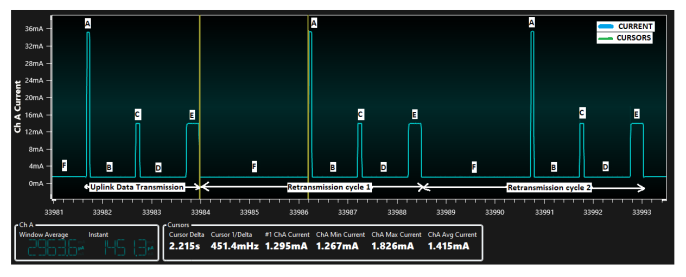
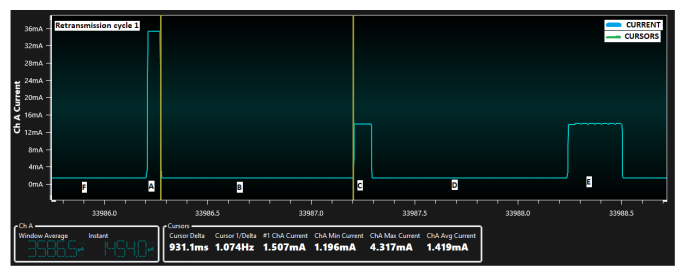
The following figure illustrates the data retransmission with time delta on the retransmission delay slot at DR5.
The following figure illustrates the zoomed-in plot of retransmission cycle 1 with time delta on the transmission of the uplink slot at DR0.
The following figure illustrates the zoomed-in plot of the retransmission cycle 1 with time delta on the transmission of the uplink slot at DR5.
The following figure illustrates the zoomed-in plot of the retransmission cycle 1 with time delta on the RX1 delay slot at DR0.
The following figure illustrates the zoomed-in plot of the retransmission cycle 1 with time delta on the RX1 delay slot at DR5.
The following figure illustrates the zoomed-in plot of the retransmission cycle 1 with time delta on the RX1 reception window slot at DR0.
The following figure illustrates the zoomed-in plot of the retransmission cycle 1 with time delta on the RX1 reception window slot at DR5.
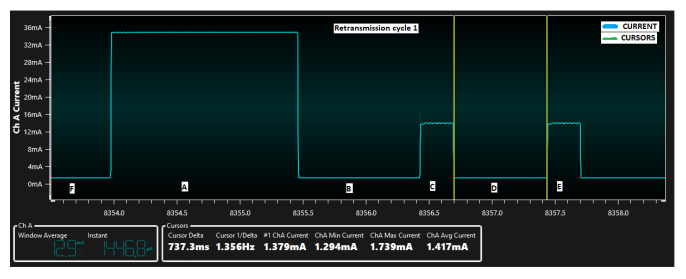
The following figure illustrates the zoomed-in plot of the retransmission cycle 1 with time delta on the RX2 delay slot at DR0.
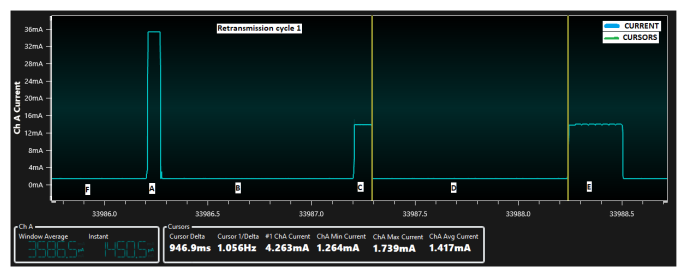
The following figure illustrates the zoomed-in plot of the retransmission cycle 1 with time delta on the RX2 delay slot at DR5.
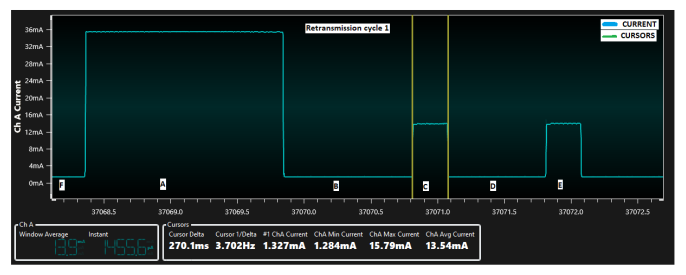
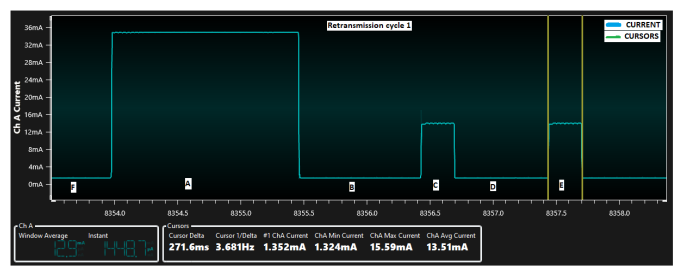
The following figure illustrates the zoomed-in plot of the retransmission cycle 1 with time delta on the RX2 reception window slot at DR0.
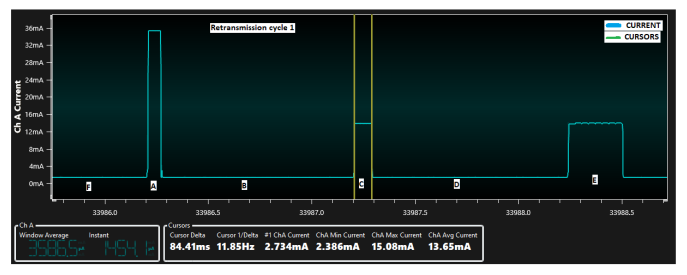
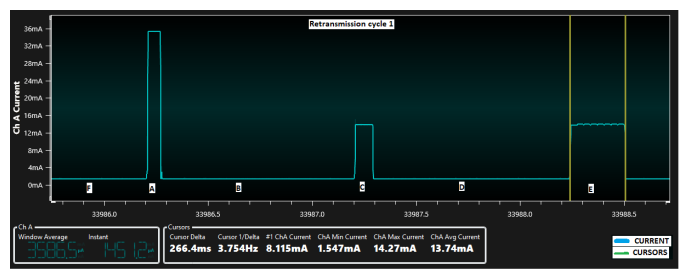
The following figure illustrates the zoomed-in plot of the retransmission cycle 1 with time delta on the RX2 reception window slot at DR5.
The following tables provide the consumption values in each instance of retransmission, including the retransmission delay and total power consumption for one transmission cycle.
|
Attribute |
Measured Value |
Units | |
|---|---|---|---|
|
DR0 |
DR5 |
||
|
Total duration |
1488 |
65.40 |
ms |
|
Average current |
34.77 |
33.54 |
mA |
|
Peak current |
35.14 |
35.45 |
mA |
|
Total charge |
51737.76 |
2193.52 |
mA×ms |
|
Attribute |
Measured Value |
Units | |
|---|---|---|---|
|
DR0 |
DR5 |
||
|
Total duration |
2290 |
2215 |
ms |
|
Average current |
1.415 |
1.415 |
mA |
|
Peak current |
1.806 |
1.826 |
mA |
|
Total charge |
3240.35 |
3134.26 |
mA×ms |
|
Attribute |
Measured Value |
Units | |
|---|---|---|---|
|
DR0 |
DR5 |
||
|
Total duration |
953.4 |
931.1 |
ms |
|
Average current |
1.411 |
1.419 |
mA |
|
Peak current |
1.789 |
4.317 |
mA |
|
Total charge |
1345.25 |
1321.24 |
mA×ms |
|
Attribute |
Measured Value |
Units | |
|---|---|---|---|
|
DR0 |
DR5 |
||
|
Total duration |
270.1 |
84.41 |
ms |
|
Average current |
13.54 |
13.65 |
mA |
|
Peak current |
15.79 |
15.08 |
mA |
|
Total charge |
3657.16 |
1152.20 |
mA×ms |
|
Attribute |
Measured Value |
Units | |
|---|---|---|---|
|
DR0 |
DR5 |
||
|
Total duration |
737.3 |
946.9 |
ms |
|
Average current |
1.417 |
1.417 |
mA |
|
Peak current |
1.739 |
1.739 |
mA |
|
Total charge |
1044.76 |
1341.76 |
mA×ms |
|
Attribute |
Measured Value |
Units | |
|---|---|---|---|
|
DR0 |
DR5 |
||
|
Total duration |
271.6 |
266.4 |
ms |
|
Average current |
13.51 |
13.74 |
mA |
|
Peak current |
15.59 |
14.27 |
mA |
|
Total charge |
3669.32 |
3660.34 |
mA×ms |
The following is the MAC state sequence for one retransmission cycle:
RETRANSMISSION_DELAY + TX_OCCURING + BEFORE_RX1 + RX1_OPEN + BETWEEN_RX1_RX2 + RX2_OPEN
|
Attribute |
Measured Value |
Units | |
|---|---|---|---|
|
DR0 |
DR5 |
||
|
Total duration |
6645 |
4530 |
ms |
|
Average current |
9.891 |
2.841 |
mA |
|
Peak current |
35.14 |
35.45 |
mA |
|
Total charge |
65725.70 |
12869.73 |
mA×ms |