Once a schematic has been completed, the MPLAB Mindi Analog Simulator can be used to model the circuit response in several different ways. Since the circuit used in this example has a simulated input source already included, the easiest simulation to run will be to probe the input and output of the operational amplifier and plot the circuit response over time.
Mindi allows users to place fixed probes onto a schematic so that the resulting waveforms will appear once a simulation has been completed. A fixed probe can be placed by going to the Probe tab on the top toolbar and selecting from options, such as a voltage, current or power probe. As shown in the PIC18-Q41 non-inverting amplifier example, a fixed voltage probe labeled VIN was placed on the amplifier input and a fixed voltage probe labeled VOUT was placed on the amplifier output.
Mindi also allows users to probe circuits interactively in real time, allowing them to view a variety of different measurements and waveforms. Some of the interactive probe options can be found on the quick access toolbar in Mindi, but a complete list of the different interactive probes available can be viewed under the Probe tab.
To begin a simulation in Mindi, either press the play button located on the quick access toolbar or go to the Simulator tab and click Run Schematic. If there are any fixed probes placed in the circuit, the associated waveforms should appear once the simulation has completed.
There are several types of analysis available when running a simulation; they can be selected by clicking Choose Analysis under the Simulator tab on the top toolbar. In this example, a transient analysis of the operational amplifier input and output signal was performed over 40 ms. After an analog circuit has been successfully simulated, several different analysis options will populate on the Mindi toolbar and can be used to analyze the waveforms generated in greater detail.
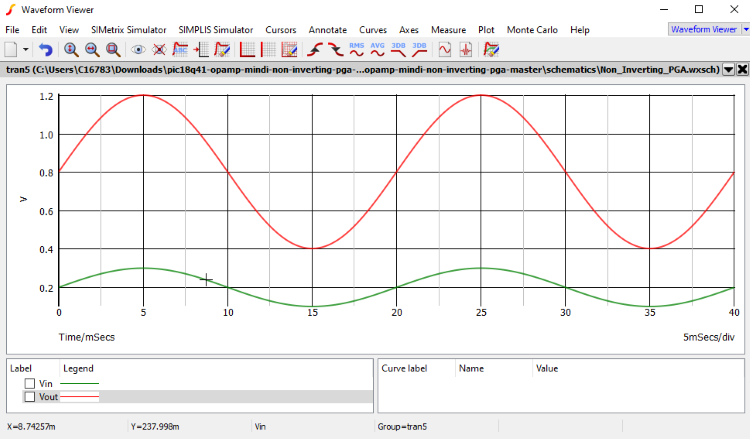
These tools can be used for many functions, such as annotating simulation results, creating other graphs using the simulated data, or adding cursors and curves. Figure 1 shows the simulation results for the PIC18-Q41 non-inverting amplifier example that has been discussed up to this point. The waveforms generated represent the sinusoidal input source applied to the circuit (shown in green) and the operational amplifier output voltage (shown in red).