Using the Embedded Debugger on the ATmega328P Xplained Mini board to debug the ATmega328P via debugWIRE.
- 1.Start Atmel Studio.
- 2.Connect the Xplained Mini USB to the PC.
- 3.Open your project.
- 4.Click the “Project” tab and select the project “properties”, click the “Tools” tab, and select mEDBG as debugger and debugWIRE as interface.
- 5.Click the “Debug” tab and select “Start Debugging and Break”.
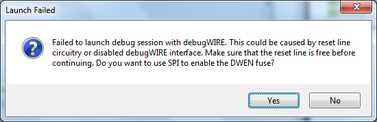
- 6.Atmel Studio will display an
error message if the DWEN fuse in the ATmega328P is not enabled, click YES to make Studio set the fuse
using the ISP interface.
- 7.A debug session is started with a break in main, and the debugging can start.
- 8.To exit debug mode, select “Disable debugWIRE and Close” in the Debug tab. This will disable the DWEN fuse.
If debug mode is not exited by selecting “Disable debugWIRE and Close” in the Debug menu, the DWEN fuse will be enabled, and the target will still be in debug mode, i.e., it will not be possible to program the target using ISP.
If any other CPU CLK than the external CLK supplied by the mEDBG is used, the debugWIRE is not guaranteed to work.
Applying a signal to J202/RESET (the RESET_SENSE signal) while debugging may result in unexpected behavior. This signal is NOT available during a debugging session because the RESET line is actively used by the debugWIRE interface.