Once the application code has been developed and the hardware has been set up, it is time to run the application and to set up Data Visualizer in order to observe the ADC functionality and the power measurement.
Todo:
- Set up the Data Visualizer terminal in Atmel Studio to display the ADC data transmitted from the evaluation kit via the EDBG Virtual COM Port, and observe the ADC functionality.
- Set up the power analysis in Data Visualizer and observe the microcontroller's current consumption in Data Visualizer.
- 1.Open the Data Visualizer in Atmel Studio by clicking Tools → Data Visualizer.
- 2.Connect ATtiny817 Xplained Pro to Data Visualizer, refer to Figure 1, by
- 2.1.Open Serial Port Control Panel by clicking Configuration → External Connection → double-click Serial Port.
- 2.2.Select ATtiny817 Xplained Pro's
Virtual COM port by selecting EDBG Virtual COM Port from the drop-down list.Tip: The EDBG Virtual COM Port number associated with the ATtiny Xplained Pro kit can be found in Windows Device Manager by clicking: Start → Control Panel → Device Manager → Ports.
- 2.3.Set the Baud rate to 96000 in the Baud rate field.
- 2.4.Open the terminal window by clicking Connect in the Serial Port Control Panel.
Figure 1. Connect to Data Visualizer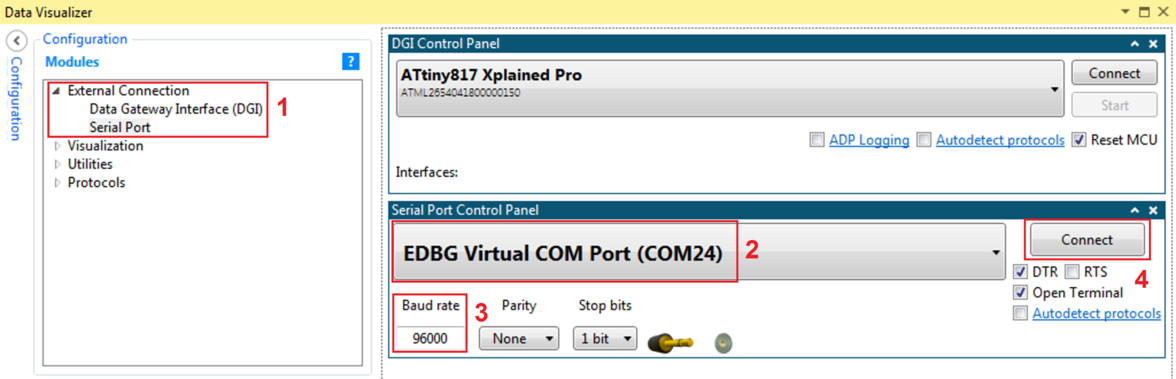
- 3.Ensure human-readable print-out from the terminal window, by selecting Hexadecimal Values, see Figure 2
- 4.Observe the ADC functionality by seeing how
the values in the terminal window changes as the potmeter knob is rotated, as shown in Figure 2.Figure 2. ADC Results in Terminal Window
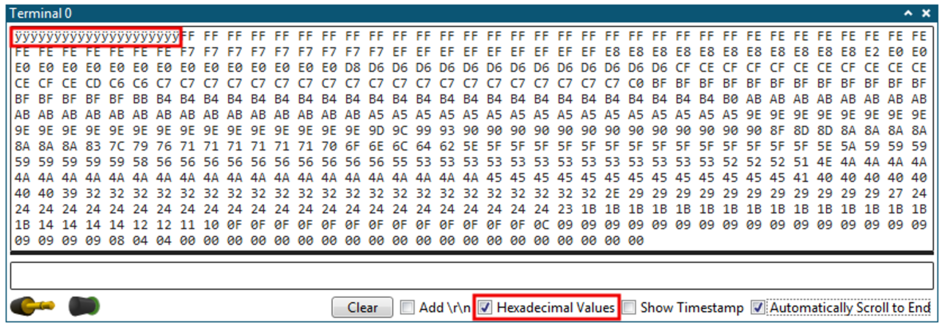 Info: As the ADC resolution has been configured to 8 bits, the ADC result printed to the terminal window will range from 0x00 to 0xFF, when the potentiometer knob is rotated.
 - 5.Open the Power Analysis window in
Data Visualizer, as shown in Figure 3, by
- 5.1.Connect ATtiny817 Xplained Pro
to the data gateway interface by clicking Connect in DGI Control Panel by
pressing the Connect button.Info: This button will show as Disconnect once ATtiny817 Xplained Pro is connected.
- 5.2.Enable for power data being sent from ATtiny817 Xplained Pro to the data gateway interface by selecting Power in DGI Control Panel.
- 5.3.Start receiving data through the data gateway interface by clicking Start.
Figure 3. DGI Control Panel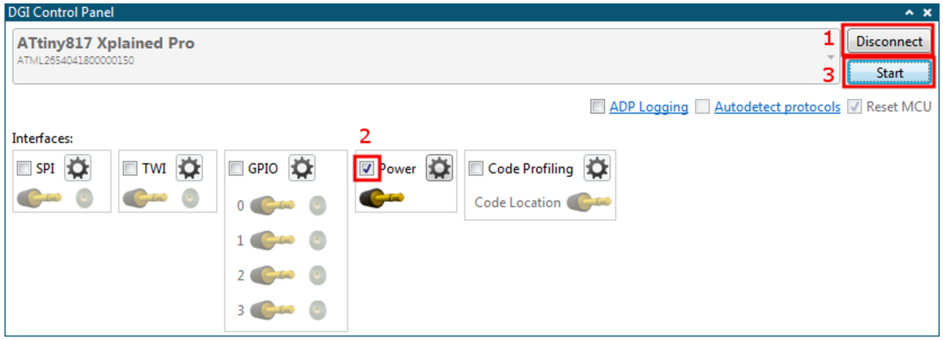 Info: A Power Analysis window should appear in Data Visualizer.
 - 5.1.Connect ATtiny817 Xplained Pro
to the data gateway interface by clicking Connect in DGI Control Panel by
pressing the Connect button.
- 6.Observe the current consumption for
ATtiny817 in Power Analysis, as shown in Figure 4. Figure 4. Power Analysis Window
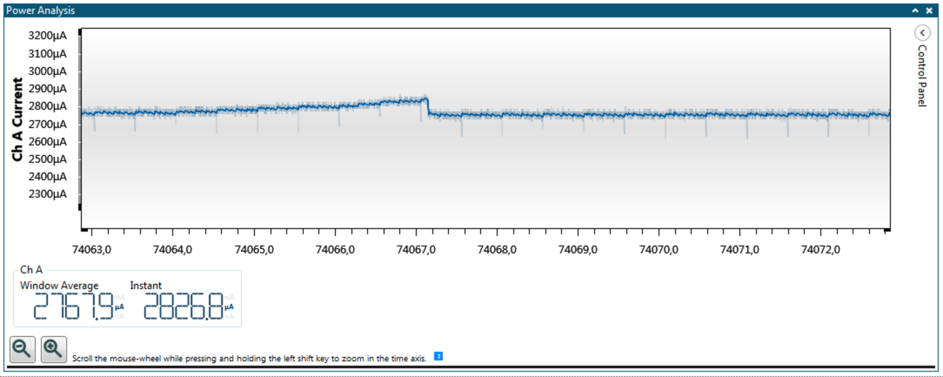 Info: As shown in Figure 4, the average current consumption of ATtiny817 is around 2.8 mA, with small variations when rotating the potentiometer knob.Note: The power consumption may vary depending on the value of the potentiometer connected (e.g. the current consumption can be 2.1 mA with another potentiometer). The power consumption measured in the following assignments could also vary slightly.Info: The power consumption is high compared to the performance of ATtiny817. The following assignments will use different techniques which will reduce the power consumption.
Result: By
connecting ATtiny817 Xplained Pro to Data Visualizer one can easily observe the
ADC functionality through a terminal window, and by using the current measurement features of
ATtiny817 Xplained Pro, the device's consumption can be observed.