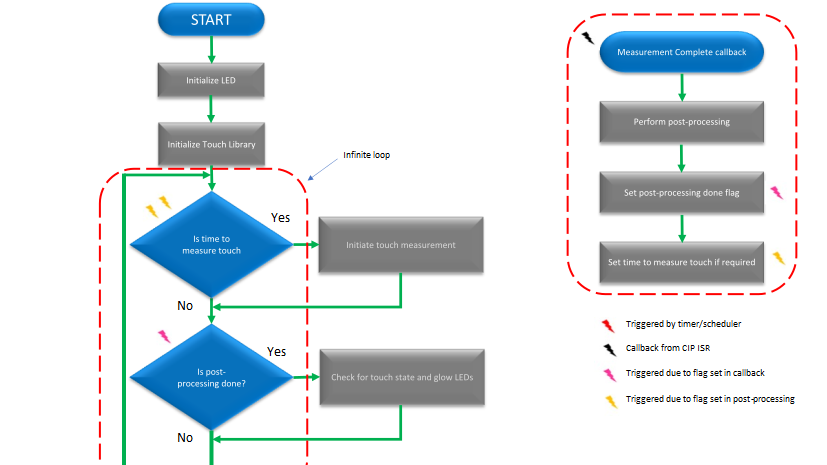
The following diagram shows the application flow. Touch measurement is performed at
regular intervals and at the end of each measurement, and then the data is processed to
find touch states. Depending on the touch states, the LEDs are updated accordingly.
Figure 1. Application Flow