PC profiling is a method for examining C code to determine the percentage of time that is spent in each function. This information can show you where your program time is being spent so you can work to optimize your code.
For PC profiling, every program counter (PC) trace sample is taken from
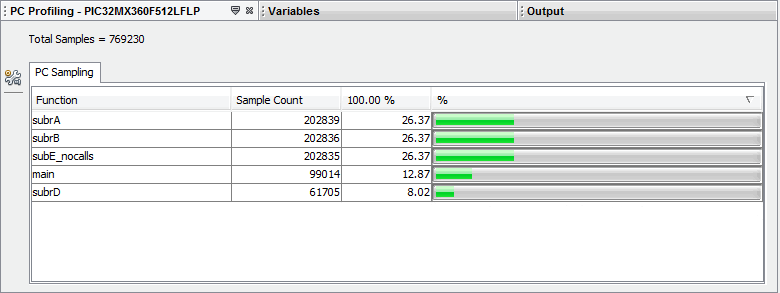
the trace (data) buffer and profiled. This data is displayed in the PC Profiling window.
In this example, the trace buffer contains 769,230 PC sample data points. Of these,
99014 (or 12.87%) were associated with the main() function, 202,839 (or
26.37%) with the subrA() function, etc.
PC profiling is similar to PC sampling. For details see PC Sampling – 16-Bit PIC MCUs Only.
Figure 1. PC Profiling - 32-bit Device