We now have two variables to monitor, and need to display them on a graph.
Todo:
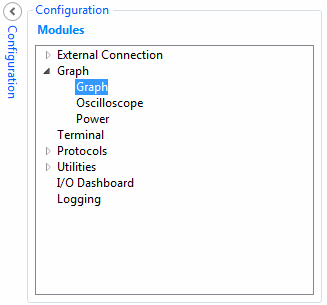
- Open the Configuration panel in Data Visualizer
- Add a graph by double-clicking the Graph module
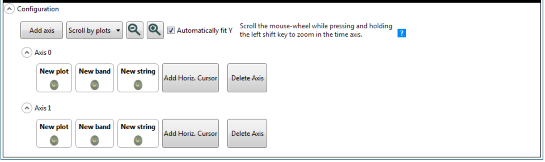
A new Graph element will open with one y axis configured. However, there are two unrelated variables to monitor, therefore, two axes are needed.
Todo:
- Click the Add axis button to add an additional axis
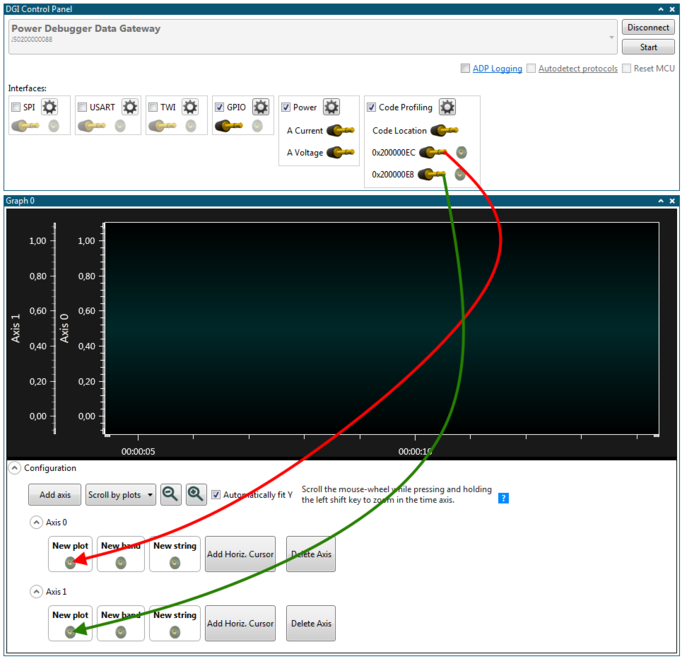
There are now sources (variables) and sinks (axes), to be connected together.
Todo: Drag
each of the source plugs on the
Code Profiling interface into the
New plot
(sink) jack of each axis.
Todo: In
Atmel Studio click Continue (F5) to resume execution.
Tip: A USB device in the
HALT state no longer responds to Windows events, and may be disconnected from the
bus if held in this state for too long. To remedy this simply reset execution in
Atmel Studio.
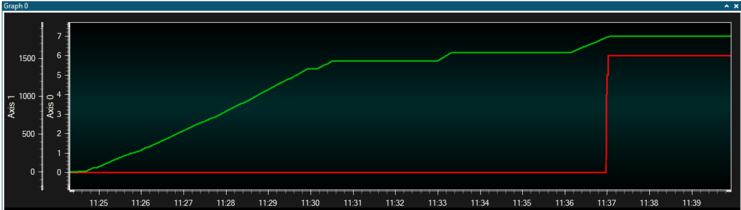
Look at the output in the graph in Data Visualizer. Format the
disk and watch how the write cycles counter increments. Both values are plotted on
independent axes, so they can be scaled accordingly. The output should look something
like this: