Running Data Visualizer for a few seconds should give you a plot similar to this one:
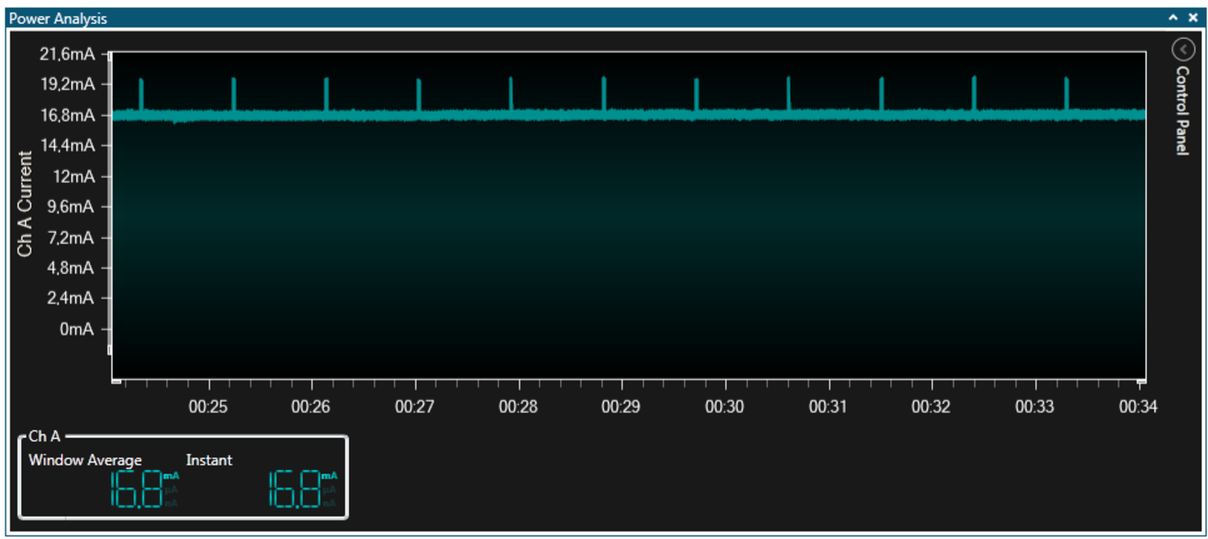
What can we see from this plot?
- The kit draws about 17 mA with the LED OFF
- Current draw increases to about 20 mA when the LED is pulsed ON
- The 1% duty cycle seems approximately correct
If your plot does not look like this, go back and check your setup for:
- Power supply to Xplained Mini (USB cable)
- Straps from VCC header to ‘A’ channel
- Common GND connection
- Is on-board power disabled on the Xplained Mini?
- Is the LED flashing? Has programming succeeded?
- Is debugWIRE (DWEN) disabled?
- If the ‘Fault’ LED on the Power Debugger is ON, check your wiring and soldering one more time