The MPLAB® Data Visualizer is used to view live data and for debugging purposes.
It can display the following variables:
- Motor speed in Revolutions per Minute (RPM)
- Motor current in mA
- System voltage in mV
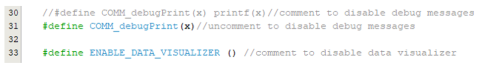
Moreover, debug messages, which display any faults or state changes, can be enabled and
viewed in the MPLAB Data Visualizer terminal section. The following lines of code are
contained in the application area of the project, in the app.c file. It
is strongly recommended that only a single functionality is enabled at once, either the
debug messages or the Data Visualizer. Debug messages are disabled by default. To enable
them, comment lines 31 and 33 and uncomment line 30. Any changes to the code require
recompiling and reuploading the project.
Configuration
- 1.Connect the MCLV-2 board to the PC using a Mini-USB cable.
- 2.Make sure the MPLAB Data
Visualizer plug-in is installed.
- 2.1.Go to Tools → Plug-ins → Available plug-ins and search for MPLAB Data Visualizer.
- 3.Launch the MPLAB Data Visualizer
and click on Load Workspace from the top bar. Select the
.jsonfile in the root of the repository.Figure 3. Loading the Workspace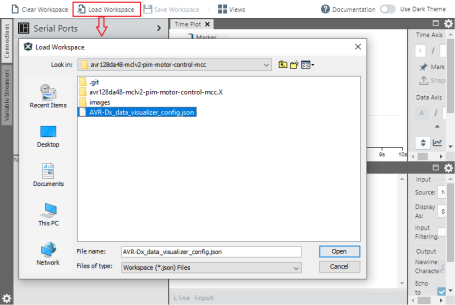
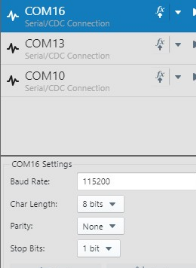
- 4.On the left Connections
tab, select the COM port and set the Baud Rate to 115200. Leave the rest
of the configuration like in Figure 4:Figure 4. COM Port Configuration
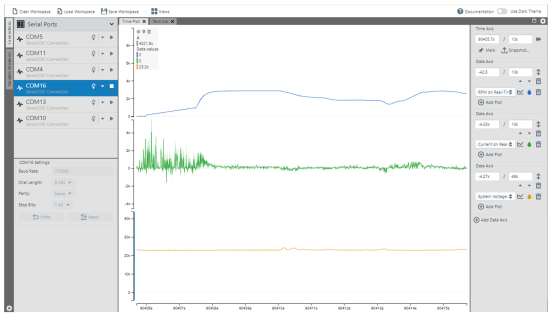
- 5.Press the Start streaming
button for the selected COM port. To view the traces on the Time Plot, the Show
Live Data mode needs to be activated.
- If debug messages are
enabled (see the
app.csource file macros), they can be viewed in the Terminal tab, with the Display As mode set to 8-bit ASCII
Figure 5. Debug Messages for Various States and Faults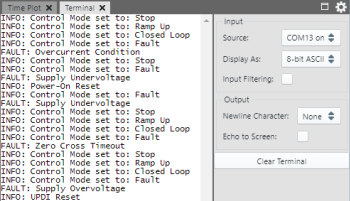
- If debug messages are
enabled (see the