The Oscilloscope module visualizes data values in real time. It has four channels for monitoring four different data streams at the same time. Each channel's data stream is visualized as a graph in the plot area, each with a different color. The vertical position and amplitude of each channel can be modified. For repeating signals, or for capturing rare events, the oscilloscope has a trigger sub-module. The oscilloscope also has a cursor system to measure various properties of the data streams.
For an example on how to configure an oscilloscope, see Oscilloscope Configuration Example.
Figure 1. The Oscilloscope Module
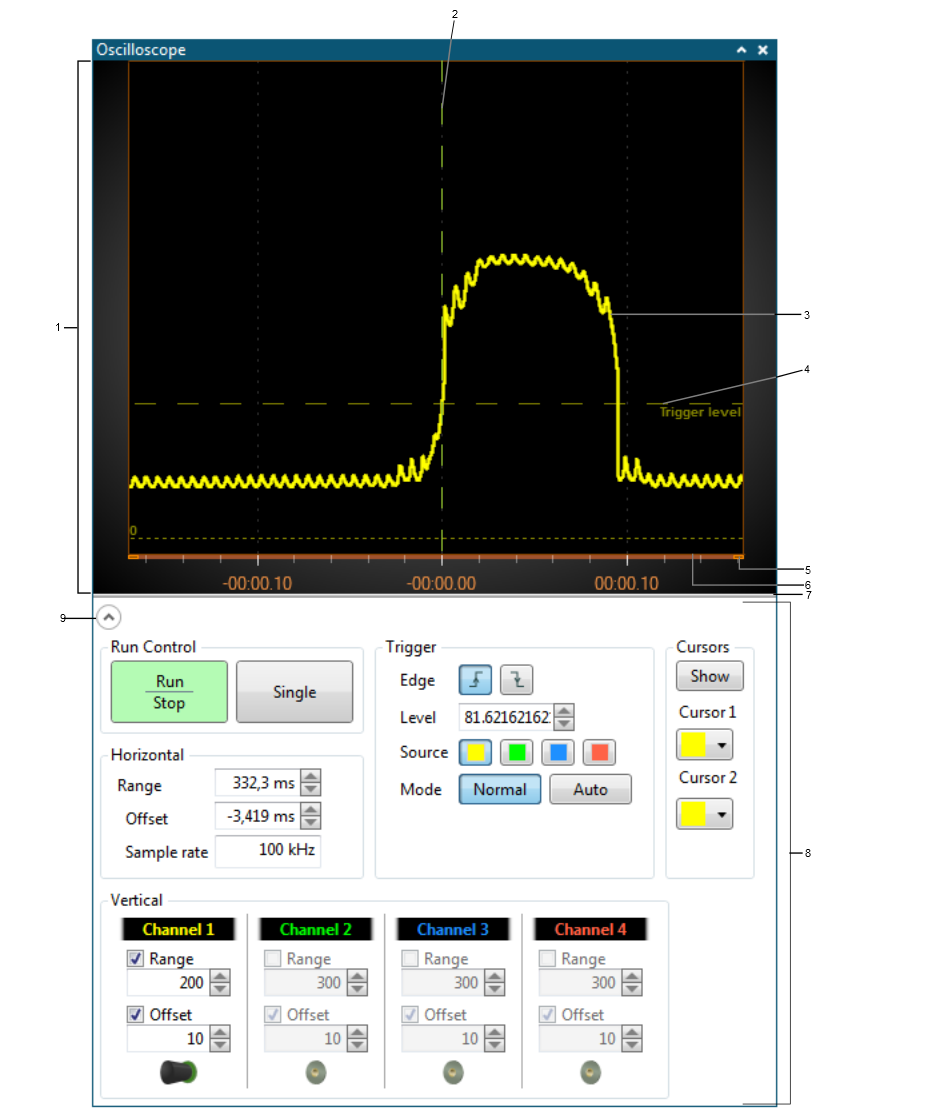
- Plot area.
- Zero-line.
- Plot.
- Trigger level indicator line.
- Time axis scale handle.
- Time axis.
- Plot area resize handle.
- Control panel.
- Show/hide control area arrow.