Power Debugging Module Control Panel

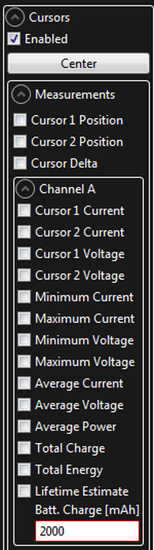
The Power Debugging module Control Panel is placed in the upper right corner of the module.

Note: Not all configuration 
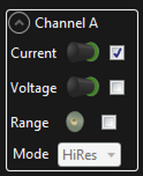
options in the control panel are available on all tools. For example, only the Power Debugger has both an A channel and a B channel. All options will be visible for all tools, but will have no effect unless the tool supports them.

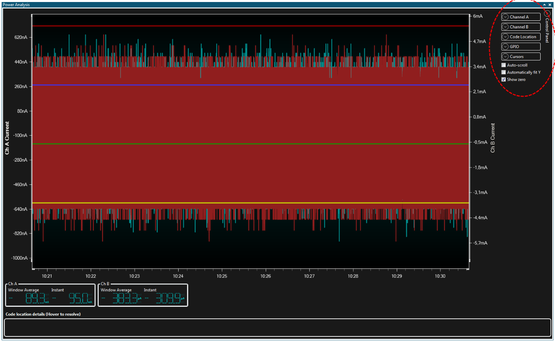
The Auto-scroll option controls the scrolling in the X-axis direction (time axis). To zoom in on and examine the graphs in detail, disable this option.

The Automatically fit Y option controls whether the Data Visualizer will automatically adjust the range of the Y axis according to the graph content or not. If this option is enabled, any manual adjustments of the Y axis will be overridden.

The Show zero option controls whether the zero-point of the Y axis should always be visible when Automatically fit Y is enabled.

Channel Configuration

For each power measurement channel there is a Channel configuration section in the Control Panel of the Power Analysis module.

The channel section allows the user to enable/disable the current and voltage graphs in the Power Analysis module.

Note: If the Enable B Channel option in the Power Configuration of the DGI Control Panel (see Power Interface) is not selected, the B channel will not be available even though the tool has a B channel. But the B channel configuration will still be visible in the Control Panel.

The Range setting enables the measurement range data for the current measurement channel. To cover the full range of current values supported by the current measurement channel, most tools have two or more hardware configurations for each channel. The number of ranges for a channel varies with the connected tool. The switching between the hardware configurations is done automatically based on the instant current measured.

Note: The range graph will only be visible if the Enable Range Source option in the Power Configuration of the DGI Control Panel is selected.

The Mode option allows for different averaging algorithms to be used for the display of data if this is enabled for the current tool.

Code Location

The Code Location section contains no options, just the source connection. To enable code locations in the Power Analysis graph the Code Profiling interface in the DGI control panel must be enabled and the Enable Code Location option in the Code Profiling Configuration of the DGI Control Panel must be enabled.

GPIO

Each of the GPIO sources can be switched ON or OFF in the GPIO section of the Control Panel of the Power Analysis module.

For GPIO data to be available for the Power Analysis module the GPIO interface has to be enabled in the DGI Control Panel.

Cursors

The Cursors section in the Power Analysis module Control Panel allows the user to enable two vertical cursors in the graph by checking the Enabled box.

The cursors can be moved by using the mouse pointer to drag them along the X-axis or they can be centered by pushing the Center button.

When the cursors are enabled the section of the graph between the cursors can be used for various measurements. The measurements will be shown in the Cursors section below the graph.

Which measurements to be shown can be selected in the Measurements sub-section of the Cursors section in the Power Analysis module Control Panel.