The Stack Monitor enables developers to monitor the stack usage of their code at run-time. This is done by sampling the Stack Pointer register via the on-chip debug module. Enable the Stack Monitor in the Code Profiling Configuration dialog, then connect the Stack Monitor source to a graph plot sink and start a debug session.
The Stack Monitor feature is implemented using polling, which means that not all stack levels will be visible. The granularity of the resulting graph is a function of the speed of the device clock, the UPDI clock speed and the nature of the application code. It is recommended to set the UPDI clock to maximum when using the Stack Monitor.
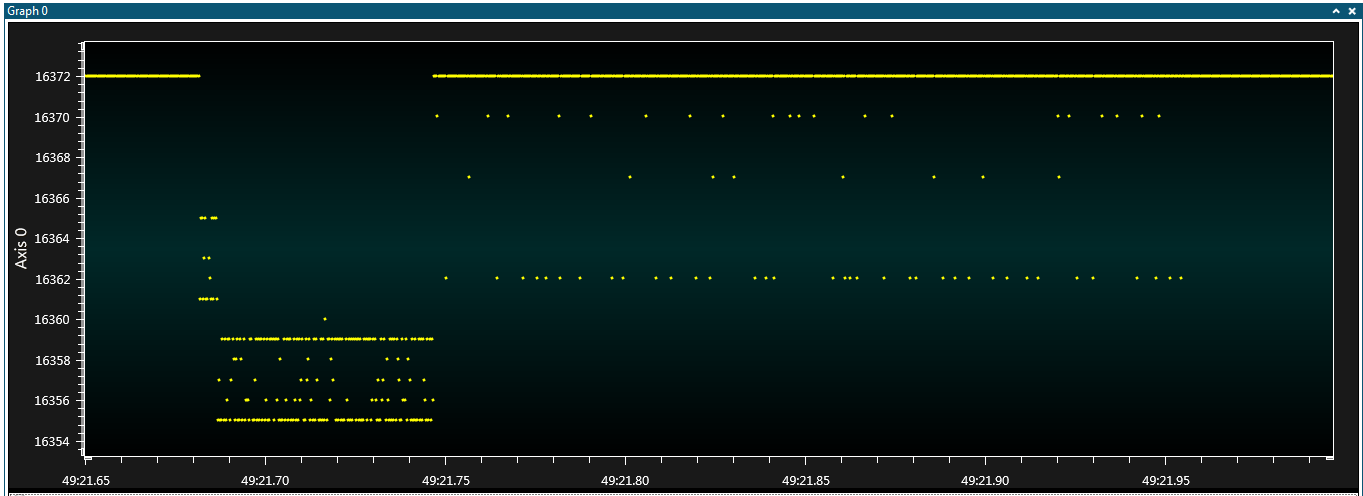
The example shown here is tracing the stack as points (not plot) from an application running on an ATtiny817. The points show samples with the Stack Pointer in "Idle state" in the main loop pointing to address 16372 (0x3FF4) and decrementing as functions are called.