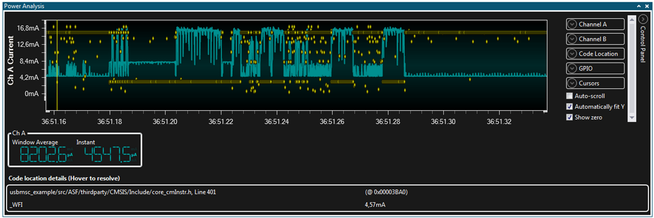
Each time the Program Counter (PC) is read out from the target, we get the exact information on the address of the code location currently being executed. The Data Visualizer can show PC values with current measurements in the same graph. This allows the user to see what is being executed by the target CPU at the various sample points of the current consumption graph. The sampled PC values will only show part of the code execution, as in most cases it is impossible to read out the PC values as fast as the target is executing instructions. The sampled values are still useful to indicate which code segment is being executed at any point in time.
A SAM L21 Xplained Pro board running a Mass Storage Class example will be used to demonstrate PC polling.
Both Target USB and Debug USB connectors of a SAM L21 Xplained Pro board is connected to a host computer. The ATSAML21 target device is running the USB Device MSC Example from ASF for SAM L21 Xplained Pro (in Atmel Studio select File→New→Example Project and search for “MSC”). The Current Measurement jumpers on the kit are set to measure MCU current and bypass I/O current.
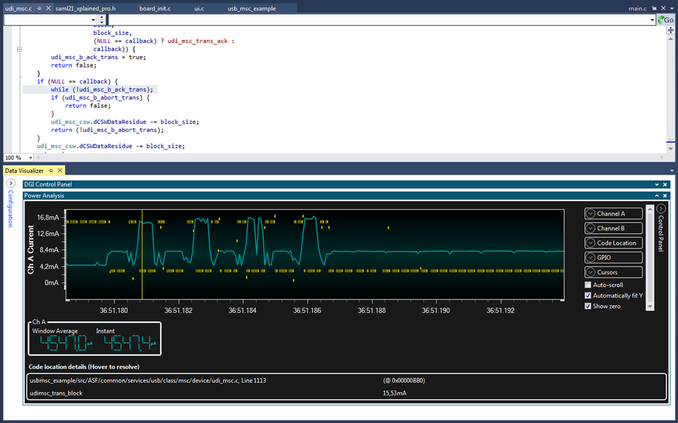
A disk format operation consists of both read and write operations, but from the current graph it is difficult to see what is going on when. To get more information on what is going on in the target at the various points in the current graph, the Program Counter sampling feature will be useful.
- Enable both Power interface and Code Profiling interface in DGI Control Panel

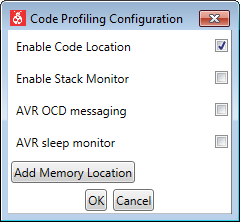
- Open the Code Profiling Configuration dialog by clicking the Gear button on the Code Profiling interface
- Select Enable Code Location