Cursors

The oscilloscope has two cursors that can be used to inspect the plots. The cursors simplify measurements such as pulse widths, amplitudes, frequencies, and so on.

Each cursor is displayed in the plot area as two lines, one vertical and one horizontal. When the vertical cursor line is moved, the horizontal line will follow so that the plot line, vertical and horizontal cursor lines intersect in the same point.

You can set which channel is the source for each of the cursors.

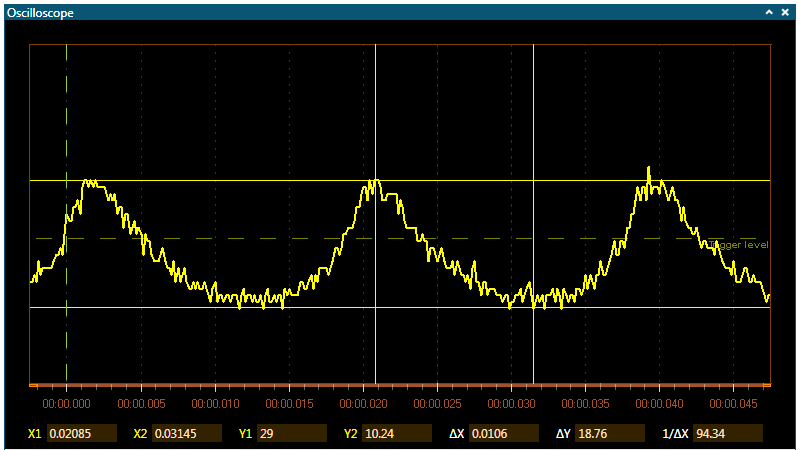
At the bottom of the plot area is the data line. It displays the X and Y values for each of the cursors. In addition, ΔX, ΔY, and 1/ΔX is calculated and displayed.

Figure 1. Oscilloscope Cursors

Show and Hide the Cursors

In the Cursor area in the Oscilloscope control panel, toggle the Show button to show or hide the cursors and the cursor data line in the plot area.

Select Cursor Source Channel

In the Cursor group in the oscilloscopeʼs control panel, click on the Cursor 1 and Cursor 2 drop-down list boxes to select the channel to use as the source for that channel. Pick the color matching the channel chosen for use.

The cursorʼs X and Y labels in the data line will change color to match the color of the channel selected.

Move a Cursor

Only the vertical line (the X value) of a cursor can be moved. The horizontal line (the Y value) will follow.

After repositioning a cursor, the readouts in the data line are updated.

Bring a Cursor Into View

After some zooming and panning, a cursor can end up far outside the visible region. It is easy to bring it back into view: