4.5.1.1 DC Signal With No Noise
- ADC2 computation mode: Basic
- Input signal: DC ~1V with no artificial noise added
- Configure VDD on the HPC board to 3.3V
- Configure the Signal & Noise Generator board to generate a DC signal of ~1V
- Verify the input signal using an oscilloscope
- Verify that LEDs D2, D3, D4, and D5 are illuminated
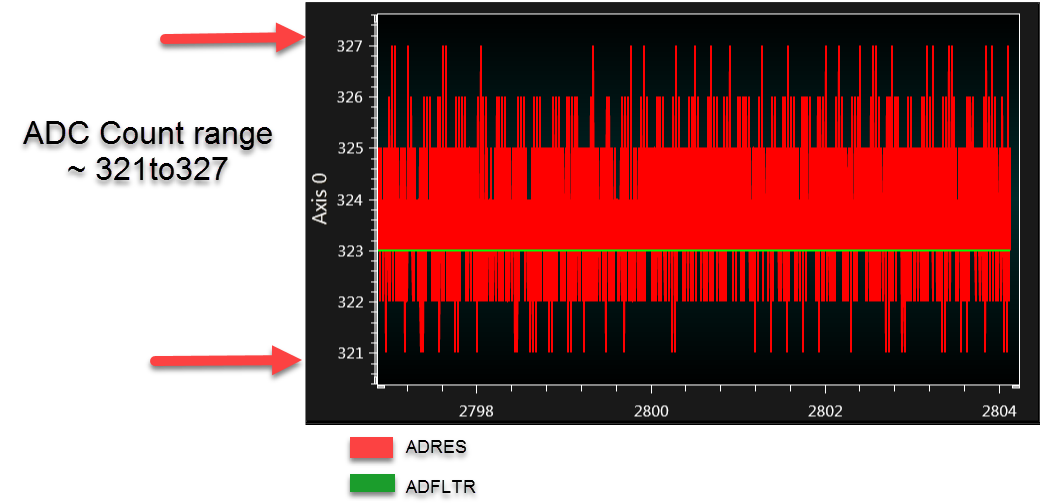
The input signal is connected to the ADC input pin RA1 and a graph in Data Visualizer is plotted as illustrated in Figure 4-1. A red colored signal is the ADC input signal (ADRES values), a green colored signal is a filtered signal using a simple averaging technique.

From the graph, the ADC filtered signal shows ADC count 323. In Basic mode, the filtered result is attained using software averaging in code with 32 samples.
ADC2 computation mode number is 1 for the Basic mode as shown in the Data Visualizer graph illustrated in Figure 4-2.

