Task: Four graphs will be plotted in Data Visualizer using a DC signal mixed with periodic noise.
- A graph with 1 ADC sample accumulation.
- A graph with 64 ADC samples accumulation.
- A graph with 64 ADC samples and automatic sampling delay variation.
- A graph with 64 ADC samples and sampling delay.
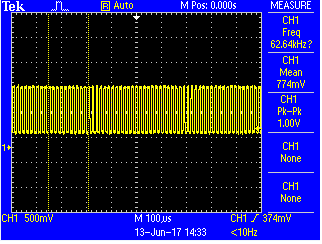
Test setup: The PWM signal is generated using peripheral TCA and added this PWM noise to the DC signal to be measured as shown in Figure 1.
The signal with PWM noise is shown in Figure 1:
1. A graph with 1-sample accumulation:
In the example code, the configuration of macro definitions is as below:
#define HARMONIC_NOISE  1
#define ADC_64X_ACCUMULATOR_ENABLE   0
#define SAMPLING_DELAY 0
#define ENABLE_ASDV  0
After downloading the code with the above macro definitions, the Data Visualizer graph is as shown in Figure 2:
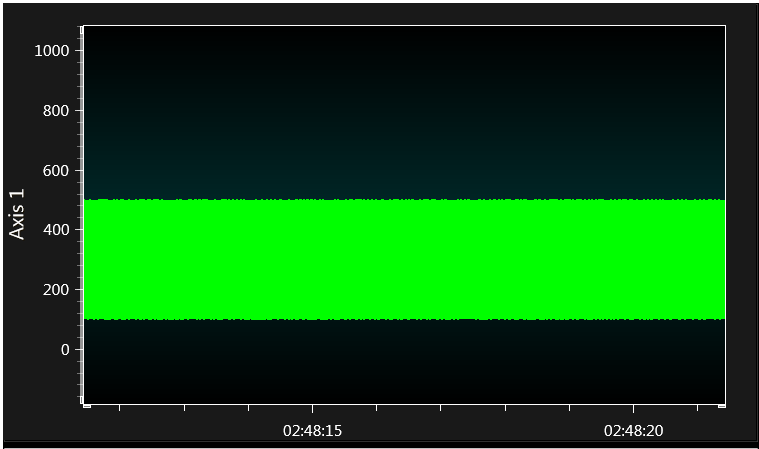
It is observed that the ADC result count value is varying around 100 to 450.
2. A graph with 64-sample accumulation:
In the example code, the configuration of macro definitions is as below:
#define HARMONIC_NOISE  1
#define ADC_64X_ACCUMULATOR_ENABLE   1
#define SAMPLING_DELAY 0
#define ENABLE_ASDV  0
After downloading the code with the above macro definitions, the Data Visualizer graph is as shown in Figure 3:
If the above signal is zoomed, the image is as shown in Figure 4:
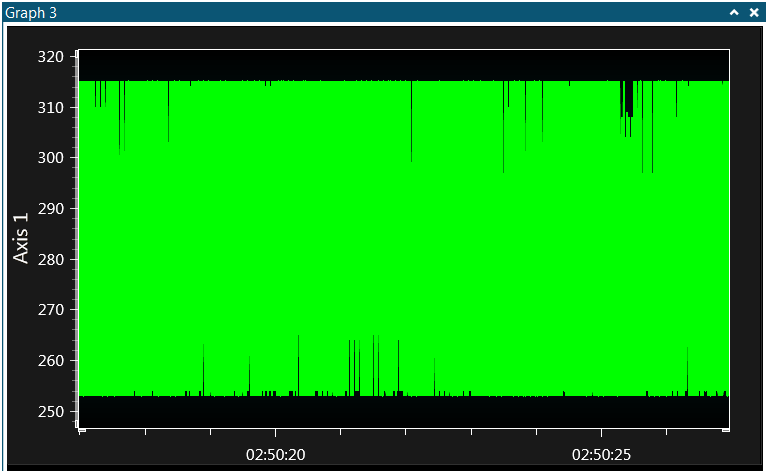
With oversampling, the ADC result count range has been reduced and the value is varying from 255 to 315. That means the ADC result count range is approx. ±30 counts.
3. A graph with 64-sample accumulation and automatic sampling delay:
In the example code, the configuration of macro definitions is as below:
#define HARMONIC_NOISE 1
#define ADC_64X_ACCUMULATOR_ENABLE 1
#define SAMPLING_DELAY 0
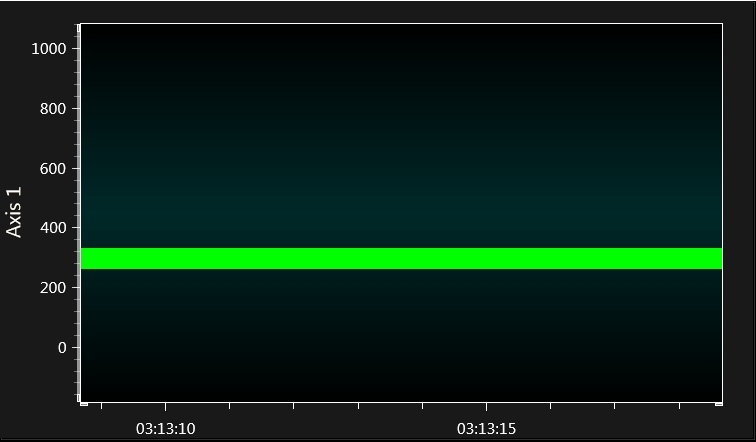
#define ENABLE_ASDV 1After downloading the code with the above macro definitions, the Data Visualizer graph is as shown in Figure 5:
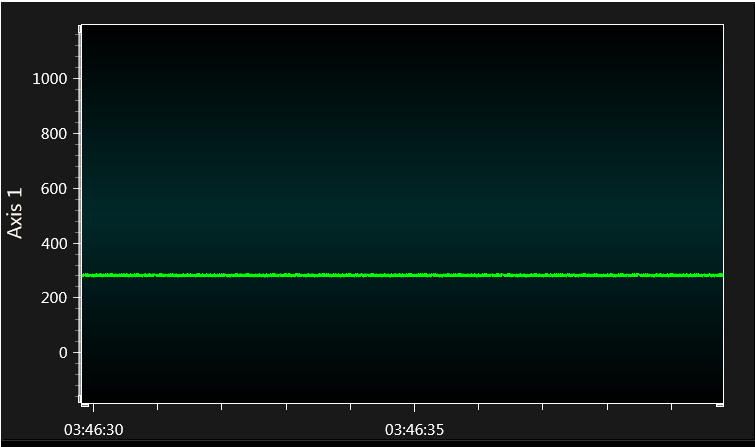
If the above signal is zoomed, the image is as shown in Figure 6:
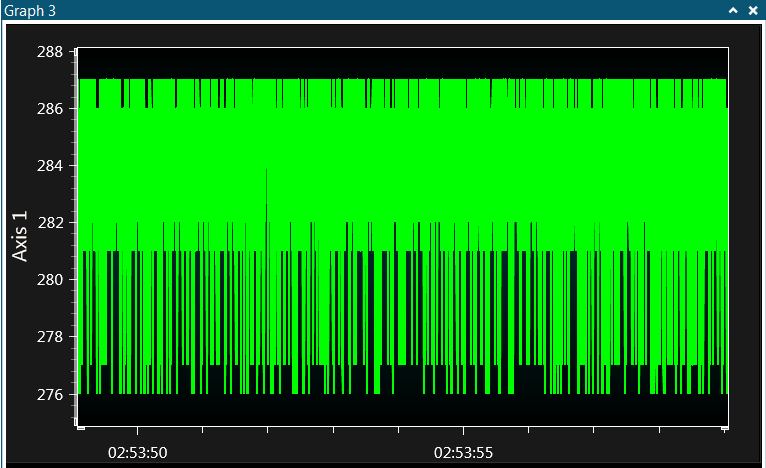
With oversampling and adding automatic sampling delay, the ADC result count range has been further reduced and the value is varying from 276 to 287. This means that the ADC result count range is approx. ±6 counts.
4. A graph with 64-sample accumulation and sampling delay:
In the example code, the configuration of macro definitions is as below:
#define HARMONIC_NOISE  1
#define ADC_64X_ACCUMULATOR_ENABLE   1
#define SAMPLING_DELAY 5
#define ENABLE_ASDV  0
In the test setup, to achieve maximum noise filtering the value of sampling delay (#define SAMPLING_DELAY) has been configured to 5. It has been configured using trial and error and it may vary from one setup to another.
When sampling delay is configured to 5, the resulting ADC sampling frequency is 3.33 MHz/(13+ 5) = 46 kHz.
After downloading the code with the above macro definitions, the Data Visualizer graph is as shown in Figure 7:
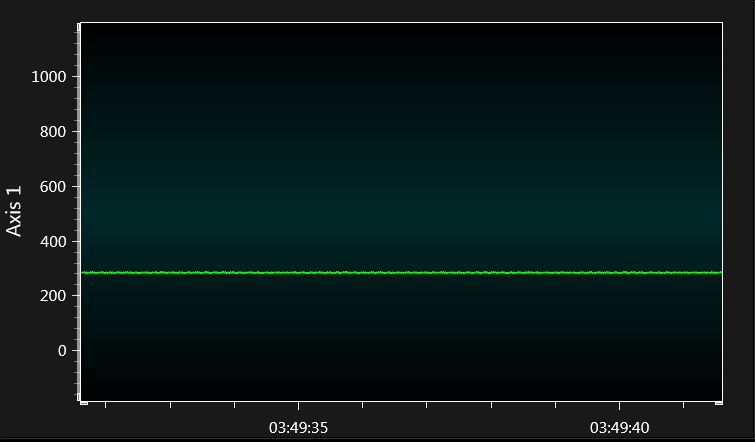
If the above signal is zoomed, the image is as shown in Figure 8:
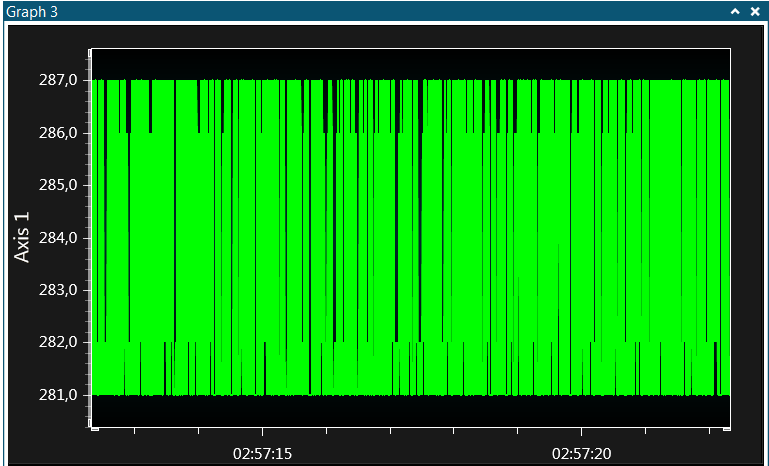
With oversampling and adding sampling delay, the ADC result count range has been further reduced and the value is varying from 281 to 287. This means the ADC result count range is ±3 counts, which shows that the configured ADC features result in suppressing the noise signal and achieving better ADC results.