Band

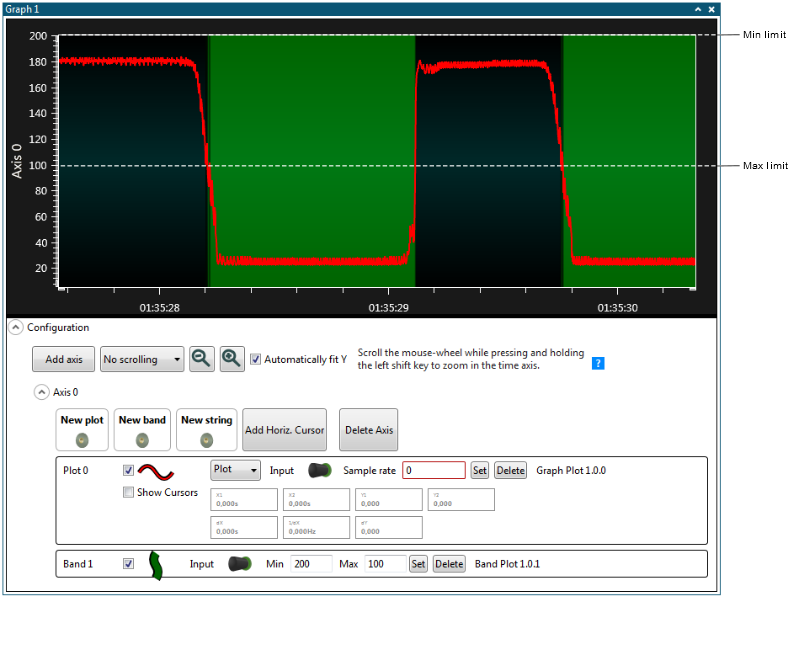
A band is a vertical marking in the plot area that highlights the plot background with the band color. For example, on the plot of a temperature reading, a band can be added that highlights portions of the plot where the temperature is above a certain value.

Figure 1. Graph Module Showing a Plot and a Band

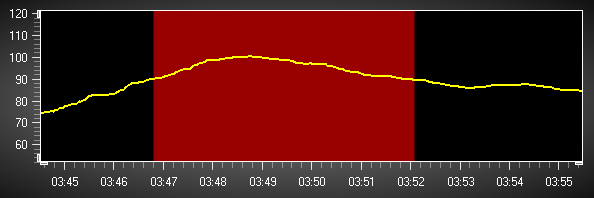
A band has a minimum and a maximum limit. The band will be active, on, if the input to the band is between these two values.

Figure 2. Band Controls

Adding and Connecting the Band

To add a new band and connect it to a data source, drag the data source plug and drop it on the New band sink connector.

Setting the Band Color

Click the band color indicator. A dialog box will open. Change the RGB values, and press OK.
Note:

When changing the band color, the change will not affect band regions already in the graph. Only new band regions will have the new color.

Setting Inverted Band Limits

Figure 3. Band with Inverted Behavior

If the maximum limit is set to a value less than the minimum value, the band will behave in an inverted manner. Now, the band will be active when the input value is less than the maximum limit, or if the input value is greater than the minimum limit.

Setting the Band Color

Click the band color indicator. A dialog box will open. Change the RGB values, and press OK.
Note:

When changing the band color, the change will not affect band regions already in the graph. Only new band regions will have the new color.

Remove a Band

To remove a band, press the Delete button in the band's control panel.