The Graph module is a versatile graph plotting tool. The large plot area has one time axis, and one or more value axes (Y axes). The value axes are stacked on top of each other. For an example on how to configure a graph, see Graph Configuration Example.
Figure 1. Graph with a Plot, Band, String
Marker, and Cursor
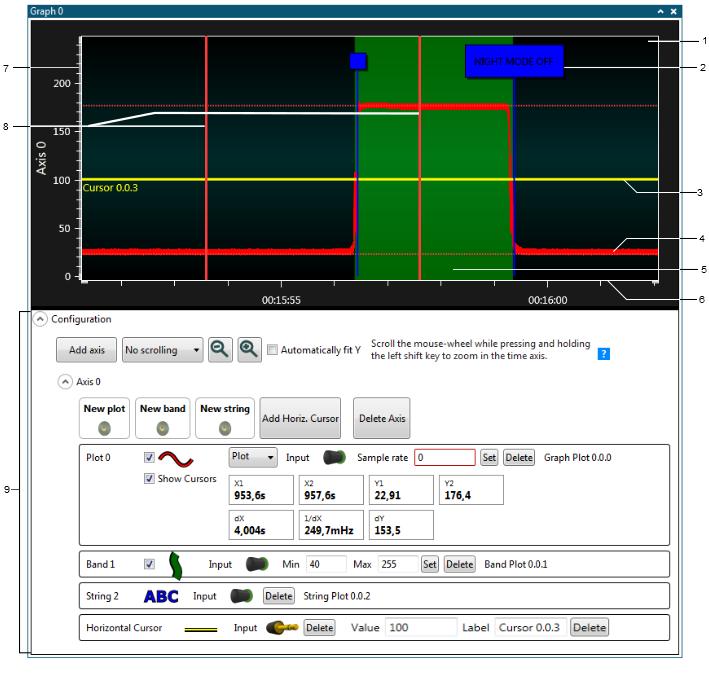
- Plot area.
- String marker.
- Horizontal cursor.
- Plot.
- Band.
- Time axis.
- Y axis.
- Plot cursors.
- Configuration panel.
There are four types of elements that can be added to an Y axis:
-
Plot
-
Band
-
String marker
-
Horizontal cursor
Each of these elements are described in the following sections.