3 Data Visualizer Setup for DV Run Time
This section describes the steps needed to set up the DV Run Time Library in the MPLAB Data Visualizer when using the MCC Melody DV Run Time Library.
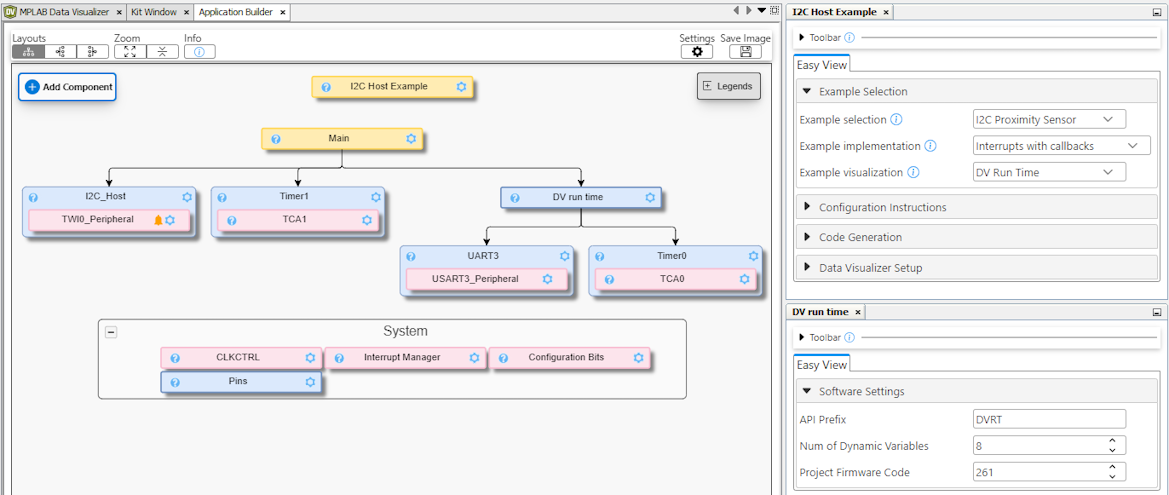
Tip: The following steps pertain to an example that
has been properly configured in MCC Melody, with the code generation initiated by
pressing the  button.
button. Tip: In the Data Streamer,
application variables must be added to the Data Streamer Table before they can be
plotted. In contrast, the DV Run Time exposes variables as debug symbols when you load
the appropriate
.elf file. To improve the chances of locating a
variable’s debug symbol, declare the variable as volatile and/or
static. The .elf files contain the variables'
names, addresses and types (length in bytes). This means that, at compile time, the
locations of volatile variables in the microcontroller’s RAM are predetermined.- Within MPLAB X, click the
 icon
to open the MPLAB Data Visualizer.
icon
to open the MPLAB Data Visualizer. - Click the
 button
to see the current DVRT session or to start a new one.
button
to see the current DVRT session or to start a new one.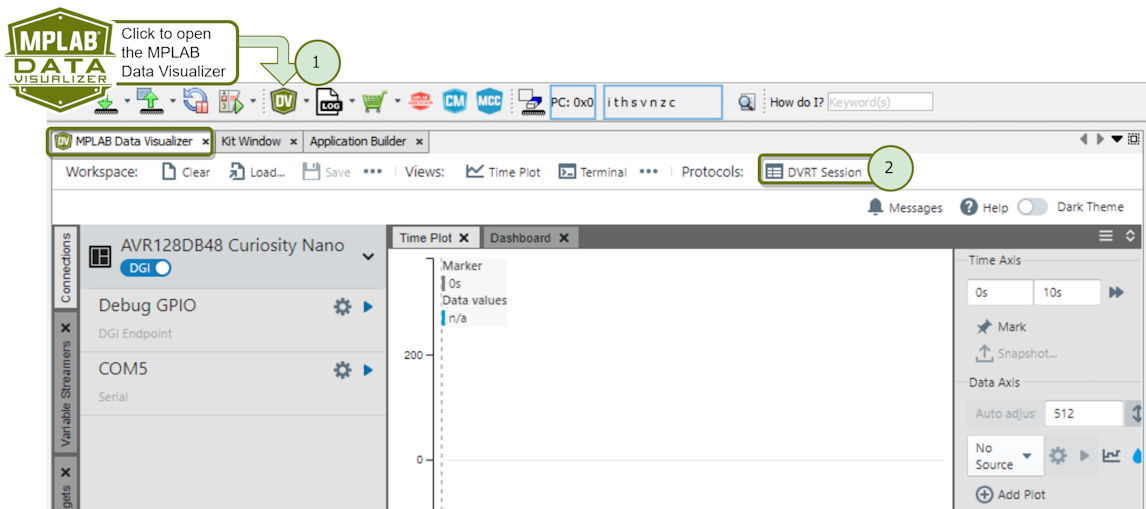
A new DVRT session will open as follows:
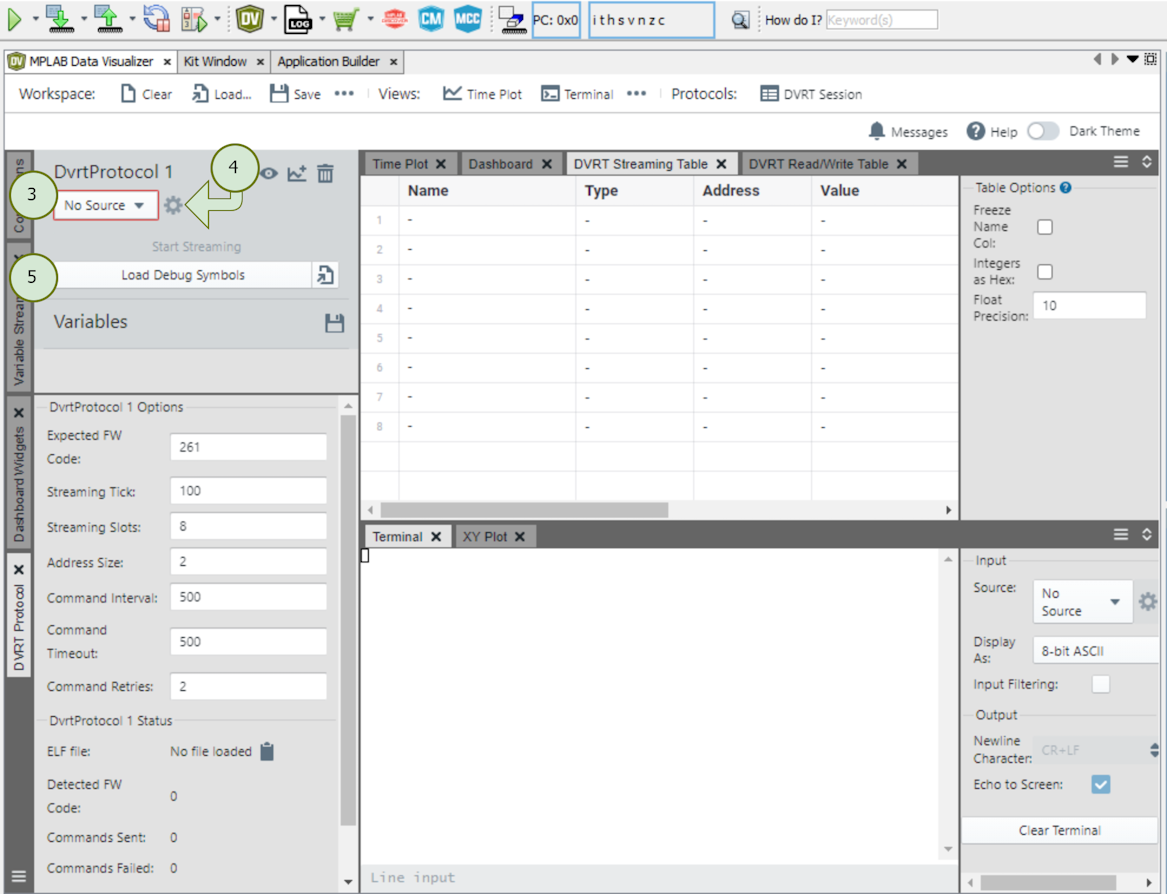
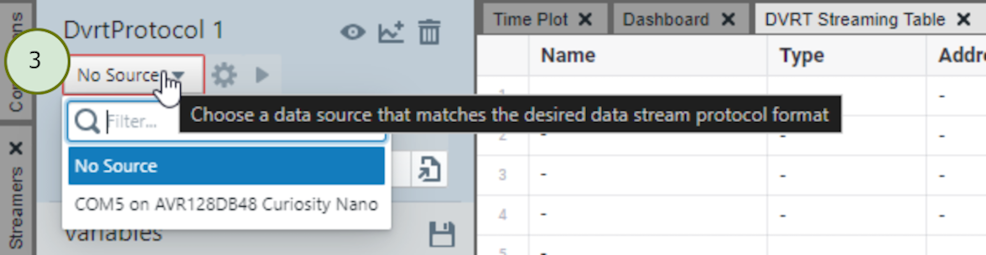
- Next, select a data source matching
the DVRT protocol format. This will be the COM port (UART) configured as a
dependency to the MCC Melody DV Run Time Library.
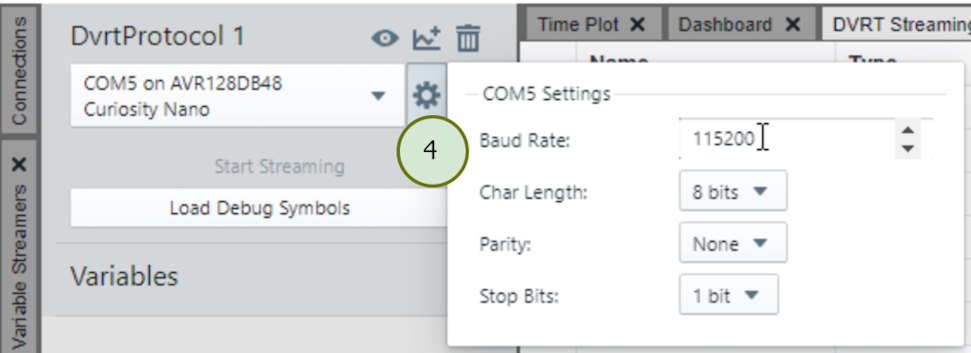
- Configure the Data Visualizer COM
Settings (PC side) to match what was configured in the MCC Melody DV Run Time
Library (MCU side).
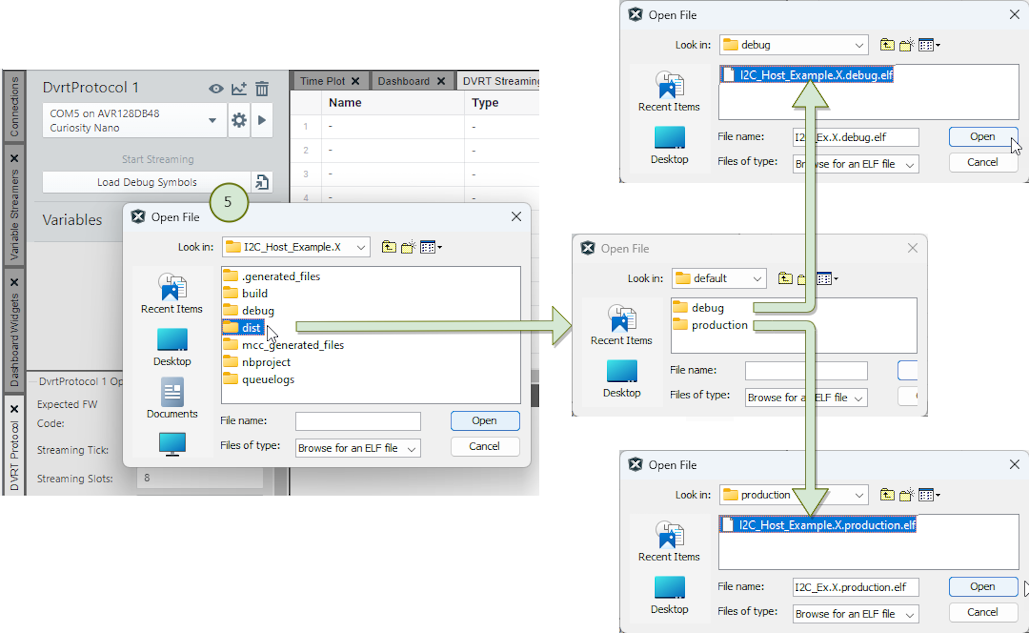
- Next, load the
.elfdebug symbols file.Attention: Choose between the debug and the production version of the.elf, depending on which matches the compilation settings:- Debug, when in a debug session
- Production, when
simply having programmed the MCU

- Add variables to the DVRT Streaming
Table.Tip: The
volatileandstaticvariables will show up in the symbols file.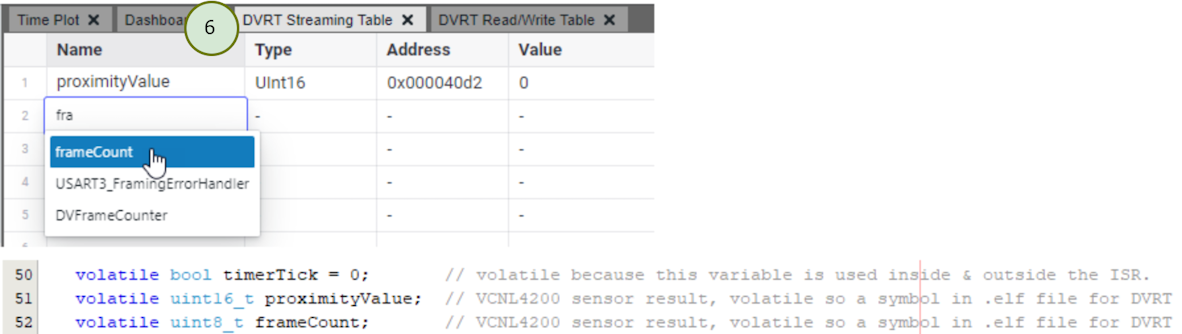
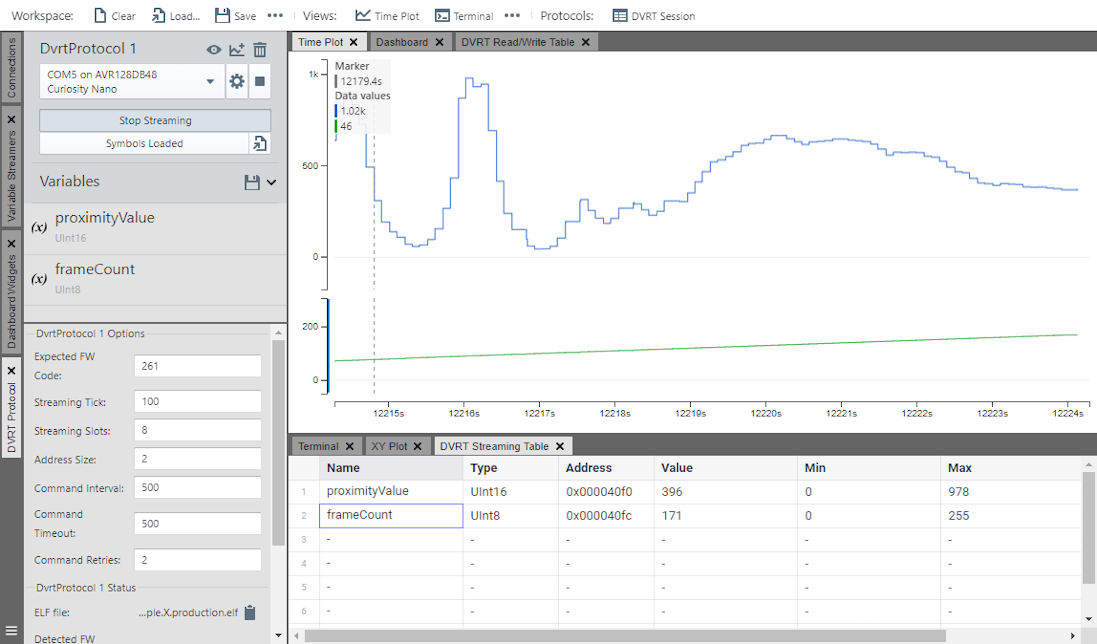
- Reposition the DVRT Streaming Table.
Tip: Drag the DVRT Streaming Table to the bottom pannel of the Data Visualizer to view it and the Time Plot variables simultaneously.
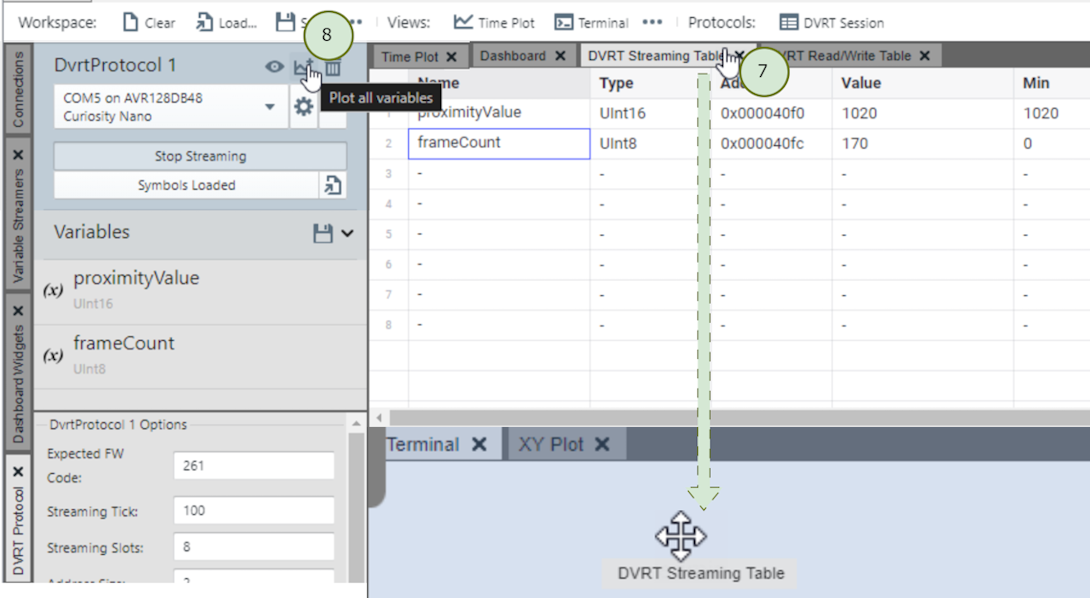
- Once the Plot all variables button
 is clicked, the DVRT Procol starts streaming and the Time Plot starts rolling.