
4.7.2.3 Debugging Details
The figure below illustrates the MPLAB ICE 4 In-Circuit Emulator system when it is ready to begin debugging. In the figure, Rpu=10 kΩ typical and Ric=4.7 kΩ.
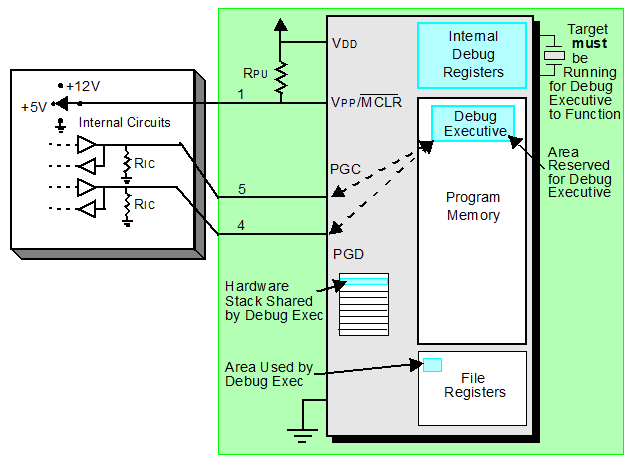
To find out whether an application program will run correctly, a breakpoint is typically set early in the program code. When a breakpoint is set from the user interface of MPLAB X IDE, the address of the breakpoint is stored in the special internal debug registers of the target device. Commands on PGC and PGD communicate directly to these registers to set the breakpoint address.
Next, the Debug

After the instruction at the breakpoint address is executed, the in-circuit debug mechanism of the target device “fires” and transfers the device’s program counter to the debug executive (like an interrupt) and the user’s application is effectively halted. The debugger communicates with the debug executive via PGC and PGD, gets the breakpoint status information, and sends it back to MPLAB X IDE. MPLAB X IDE then sends a series of queries to the debugger to get information about the target device, i.e., file register contents and the state of the CPU. These queries are performed by the debug executive.
The debug executive runs like an application in program memory. It uses some locations on the stack for its temporary variables. If the device does not run, for whatever reason (no oscillator, faulty power supply connection, shorts on the target board, etc.), then the debug executive cannot communicate to the MPLAB ICE 4, and MPLAB X IDE will issue an error message.
Another way to set a breakpoint is to select the Pause
