
15.3.2 SmartDebug User Interface
(Ask a Question)This topic introduces the basic elements and features of SmartDebug.
15.3.2.1 Standalone SmartDebug User Interface
(Ask a Question)| Operating System | Launch Instructions |
|---|---|
| Windows® | <Libero Installation folder>/Designer/bin/sdebug.exe |
<FlashPro Installation folder>/bin/sdebug.exe | |
| Linux® | <Libero Installation folder>/bin/sdebug |
<FlashPro Installation folder>/bin/sdebug |
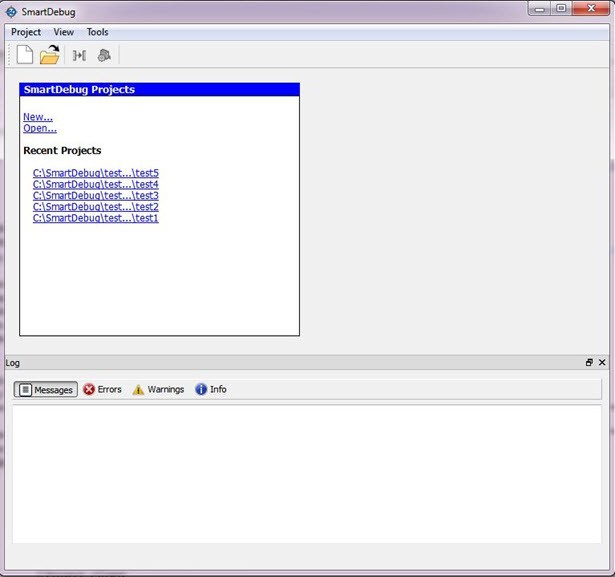
15.3.2.1.1 Project Menu
(Ask a Question)The following table describes the menu options in the Project menu.
| Menu Option | Description |
|---|---|
| New Project | Creates a new SmartDebug project. |
| Open Project | Opens an existing debug project. |
| Execute Script | Executes SmartDebug-specific Tcl scripts. |
| Export Script File | Exports SmartDebug-specific commands to a script file. |
| Recent Projects | Lists recent SmartDebug projects. |
15.3.2.1.2 Log Window
(Ask a Question)The following table describes the tabs on the Log view in the standalone SmartDebug window. This view appears when you start SmartDebug. To hide it, click .
| Tab | Description |
|---|---|
| Messages | Displays standard output messages. |
| Errors | Displays error messages. |
| Warnings | Displays warning messages. |
| Info | Displays general information. |
15.3.2.1.3 Tools Menu
(Ask a Question)The Tools menu includes Programming Connectivity and Interface and Programmer Settings options, which are enabled after creating or opening a SmartDebug project.
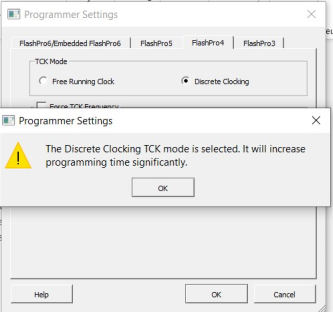
After the pop-up is closed by the user, a warning icon with a message tooltip appears next to the Discrete Clocking radio button. The icon and the tooltip appear when the programmer settings dialog is re-opened.
For more information, see Programming Connectivity and Interface.
15.3.2.2 Programming Connectivity and Interface
(Ask a Question)To open the Programming Connectivity and Interface dialog box from the standalone SmartDebug Tools menu, choose Programming Connectivity and Interface. The Programming Connectivity and Interface dialog box displays the physical chain from TDI to TDO.
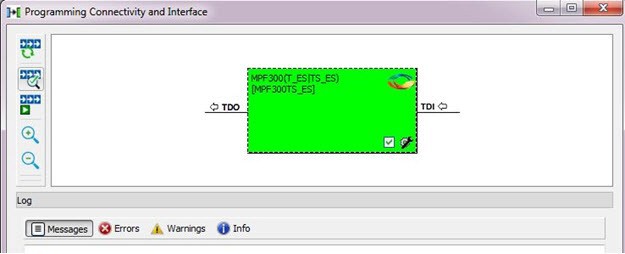
All devices in the chain are disabled by default when a standalone SmartDebug project is created using the Construct Automatically option in the Create SmartDebug Project dialog box.
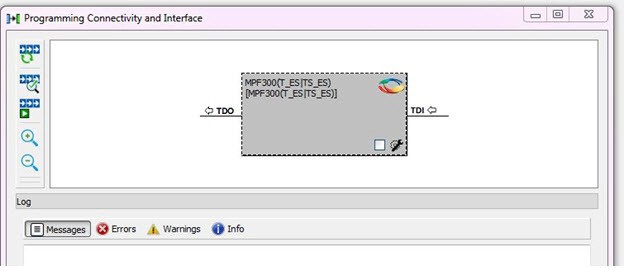
| Action | Description |
|---|---|
| Construct Chain Automatically | Construct the physical chain automatically. Running Construct Chain Automatically in the Programming Connectivity and Interface removes all existing debug/programming data included using DDC/programming files. The project is the same as a new project created using the Construct Chain Automatically option |
| Scan and Check Chain | Scan the physical chain connected to the programmer and check if it matches the chain constructed in the scan chain block diagram. |
| Run Programming Action | Program the device with the selected programming procedure. When two devices are connected in the chain, the programming actions are independent of the device. |
| Zoom In | Zoom into the scan chain block diagram. |
| Zoom Out | Zoom out of the scan chain block diagram. |
15.3.2.2.1 Hover Information
(Ask a Question)The device tooltip displays the Libero design device information if you hover the cursor over a device in the scan chain block diagram
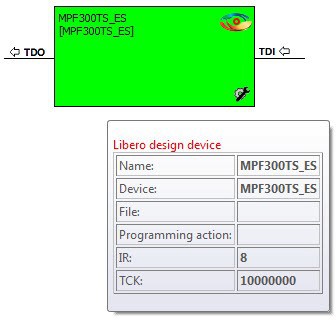
The following table describes each Libero design device information option.
| Option | Description |
|---|---|
| Name | User-specified device name. This field indicates the unique name specified by the user in the Device Name field in Configure Device (right click Properties). |
| Device | Microchip device name. |
| Programming File | Programming file name. |
| Programming Action | The programming action selected for the device in the chain when a programming file is loaded. |
| IR | Device instruction length. |
| TCK | Maximum clock frequency in MHz to program a specific device; standalone SmartDebug uses this information to ensure that the programmer operates at a frequency lower than the slowest device in the chain. |
15.3.2.2.2 Device Chain Details
(Ask a Question)The device within the chain has the following details:
- User-specified device name
- Device name
- Programming file name
- Programming action: Select Enable Device for Programming to enable the device for programming. Enabled devices are green, and disabled devices are grayed out.
15.3.2.2.3 Context Menu Options
(Ask a Question)The following options are available when you right click a device (context menu) in the Programming Connectivity and Interface dialog box.
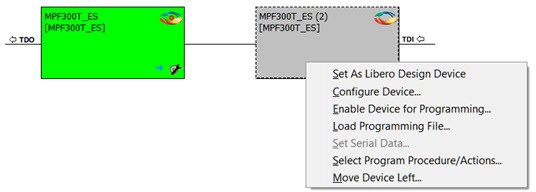
| Option | Description |
|---|---|
| Set as Libero Design Device | The user must set the Libero design device when there are multiple identical Libero design devices in the chain. |
| Configure Device | Ability to reconfigure the device.
|
| Enable Device for Programming | Select to enable the device for programming. Enabled devices are shown in green, and disabled devices are grayed out. |
| Load Programming File | Load the programming file for the selected device. |
| Select Programming Procedure/Actions | Option to select programming action/procedures for the devices
connected in the chain.
|
| Import Debug Data from DDC File | Option to import debug data information from the DDC file. Note: This option is
supported when SmartDebug is invoked in Standalone mode. The DDC file selected for import into device must be created for a compatible device. When the DDC file is imported successfully, all current device debug data is removed and replaced with debug data from the imported DDC file. The JTAG Chain configuration from the imported DDC file is ignored in this option. If a programming file is already loaded into the device prior to importing debug data from the DDC file, the programming file content is replaced with the content of the DDC file (if programming file information is included in the DDC file). |
15.3.2.2.4 Debug Context Save
(Ask a Question)Debug context refers to the user selections in debug options such as Debug FPGA Array, Debug Transceiver, and View Flash Memory Content. In standalone SmartDebug, the debug context of the current session is saved or reset depending on the user actions in Programming Connectivity and Interface.
The debug context of the current session is retained for the following actions in Programming Connectivity and Interface:
- Enable Device for Programming
- Select Programming Procedure/Actions
- Scan and Check Chain
- Run Programming Action
The debug context of the current session is reset for the following actions in Programming Connectivity and Interface:
- Auto Construct: Clears all the existing debug data. You need to re-import the debug data from DDC file.
- Import Debug Data from DDC file
- Configure Device: Renames the device in the chain
- Configure Device: Family/Die change
- Load Programming File
15.3.2.2.5 Selecting Devices for Debug
(Ask a Question)Standalone SmartDebug provides an option to select the devices connected in the JTAG chain for debug. Click the Device drop-down list to select the device. The device debug context is not saved when another debug device is selected.
15.3.2.3 View Device Status
(Ask a Question)Click View Device Status in the standalone SmartDebug main window to display the Device Status Report. The Device Status Report is a complete summary of IDCode, device certificate, design information, programming information, digest, and device security information. Use this dialog box to save or print your information for future reference.
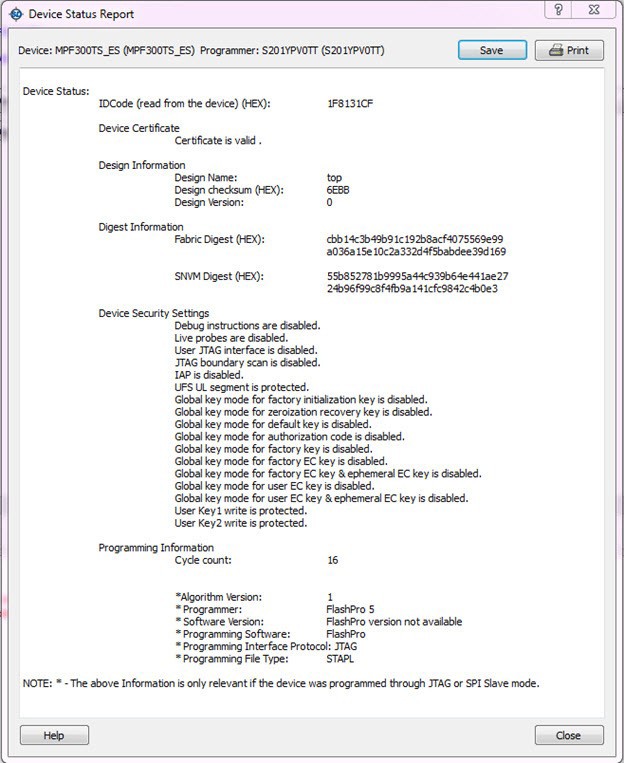
The following table describes the device status report information.
| Information | Description |
|---|---|
| IDCode | IDCode read from the device under debug. |
| Device Certificate | Displays Family and Die information if the device certificate is installed on the device. If the device certificate is not installed on the device, a message indicates that the device certificate may not have been installed. |
| Design Information | Displays the following:
|
| Digest Information | Displays Fabric Digest, sNVM Digest (if applicable) computed from the device during programming. sNVM Digest is shown when sNVM is used in the design. |
| Device Security Settings | Displays information about your security settings, including live probes, JTAG boundary scan, global key modes, and user keys. |
| Programming Information | Displays the following:
|
15.3.2.4 Connecting to a Remote Machine
(Ask a Question)Using this feature, the traditional local connection model:
is replaced with a network-enabled architecture:
This approach enables remote programmer access without physical proximity, making it ideal for distributed teams, shared lab environments, and systems deployed in restricted or hard-to-access locations.
All debug operations can be performed using the remote server feature.
15.3.2.4.1 Connecting to a Remote Machine
(Ask a Question)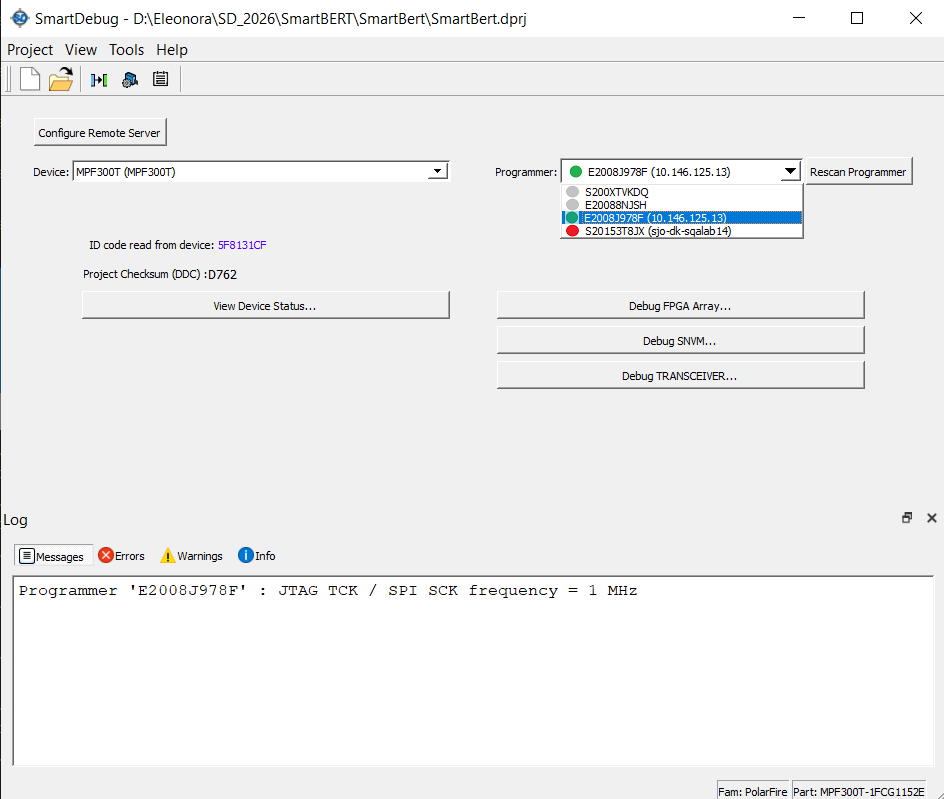
You can access the functionality by clicking on the Configure Remote Server button. This action opens the Configure Remote Server dialog box.
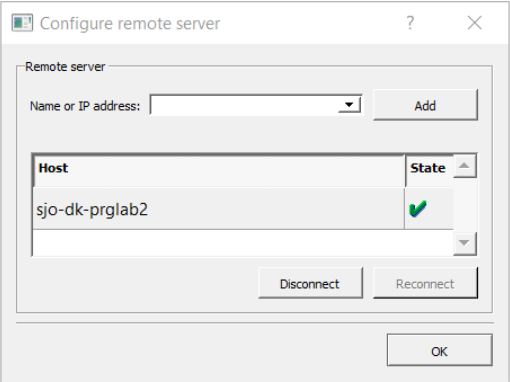
- Name or IP address
- Indicates the name or the IP address for the remote programmer server.
- Add
- Connects to the specified server and adds it to the Host list.
- Host
- Displays the remote Host(s) that you are connected to.
- State
- Indicates the status of the remote server. If the Host is found, it is confirmed by a green check mark. If the connection has failed, a red cross is shown.
- Disconnect
- Releases all the reserved programmers and disconnects you from the selected Host.
- Reconnect
- Reconnects you to the failed Host selected from the list.
Reservation Lifecycle on Disconnect or Crash
To help you understand what happens to a reservation when your session ends unexpectedly, the following list describes the two cases. Reservation behavior when the SmartDebug client disconnects unexpectedly (application crash, closed application, or lost network connection) depends on whether a programming action or debug action is in progress at the time of disconnect.
- When a programmer is reserved but no action is in progress, the server releases the programmer automatically as soon as the client disconnects.
When a programmer suddenly disconnects, the server waits for the disconnected client to reconnect. If the client stays unresponsive for 15 minutes, the programmer is released.
15.3.2.4.2 Remote Programming Server (RPS) Installation Instructions
(Ask a Question)You can make your local machine act as a remote server. This allows other users within the same network to use FlashPro programmers physically connected to it.
The RPS is installed directly with the Libero® SoC Media Installer. Complete the following instructions in the Libero SoC Setup- Follow the instructions in the wizard from the Welcome to Installation Folder windows.
- In the Select Installation Type window choose the Custom option.
- In the Select Components window with other desired components select the RPS checkbox to include the functionality in the installer.
-
In the RPS Server Configuration window, specify the
desired port numbers for programming requests.
The default ports to accept external connections are 57606 and 57605, which can be changed based on your requirements. These ports must be permitted through the firewall to enable remote access. Media Installer completes this step for you during the installation.
15.3.2.4.3 End-to-End Use Case
(Ask a Question)Complete the following steps to connect to a remote programmer and begin a debug session in SmartDebug.
- Create a new SmartDebug project or open an existing one.
- On the SmartDebug main view, click the Configure Remote Server button.
- In the Name or IP address field, enter the host name or IP address of the remote
machine. When the remote server listens on a non-default port, append it after a colon (for
example,
host:7898). - Click Add.
- When the State indicator displays a green check mark, the connection is confirmed. Programmers attached to the connected Host appear in the Programmer list automatically; no manual Refresh/Rescan is required.
- In the programmer list, read the Status column to see which
programmers are available to you:
- Available: The programmer is not reserved and can be chosen.
- In use by Other: The programmer is reserved by another user (or is temporarily blocked because another user has their own dialog box open) and cannot be chosen. Hover over the row to see who holds the reservation.
- Selected: Appears only after you click the Select column on a row. It marks the programmer you are choosing for this session.
Click the Select column on the row of the programmer you want to use. The Status value for that row changes from Available to Selected. Use the Machine, Type, and Port columns to confirm you are choosing the correct programmer when multiple rows are similar.
- Click OK to close the dialog box. The selected programmer is now reserved for your session.
- Proceed with your debug session as normal; every SmartDebug feature available for a local programmer is available for the remote one.
15.3.2.4.4 Remote Programmer Troubleshooting
(Ask a Question)To recover from connection, detection, or reservation problems in Remote Programmer functionality, follow the instructions in this section to verify network connectivity, confirm the programming server is running on the remote machine, and resolve any remaining application issues.
Configuring Network Ports
(Ask a Question)- AlmaLinux OS/Red Hat® Linux®:
- Open the terminal.
- Run the following
command:
sudo firewall-cmd --permanent --add-port
              57605-57606/tcp
- Ubuntu:
- Open the terminal.
- Run the following command:
sudo ufw allow 57605:57606/tcp
- Windows® OS:
- From the Start Menu, search for Windows Defender Firewall with Advanced Security, right-click, and select Run as administrator.
- Click Inbound Rules, then click New Rule.
- In the New Inbound Rule Wizard, you are prompted to select the type of rule you want to create. Choose Port to specify that this rule controls traffic based on network port numbers, and click Next.
- Select TCP as the protocol, since the remote programmer requires TCP communication.
- Select Specific local
ports and enter
57605, 57606to limit TCP communication access to theses two ports. Click Next. - Select Allow the connection and click Next.
- Select all three network profile options: Domain, Private, and Public. This ensures that the rule is active regardless of the type of network your computer is connected to. Click Next.
- Enter a name for the rule and click Finish.
Configuring the RPS
(Ask a Question)When the remote server is reachable on the network but no programmers are detected, refer to the Libero® SoC Media Installer to verify the post-installation checks.
If the issue has not been resolved, uninstall the RPS from the Media Installer and install again.
Application Issues
(Ask a Question)In critical cases where normal behavior cannot be achieved, run the script in administrative mode from the bin folder to clean up any stuck processes and memory.
In case of a critical crash and abnormal behavior from the remote programmer functionality,
run the bin/CleanUpRPS script in the RPS's bin folder or command shell.
- Linux®: Enter the
rm /dev/shm/*command. - Windows® OS: Navigate to the C:/ProgramData/boost_interprocess/ folder and remove all the content.
- Unified Solution: Depending on your operating system, complete the following steps:
- Find the following processes:
prgsrvdmnprgservappdbgservapp
- Kill all the processes.
Locally Connected Programmer Not Detected in Windows® OS
If everything appears to be working but your locally connected programmer is still not recognized, your antivirus or firewall may be blocking the programming software from operating correctly. To resolve this issue, follow these steps to add exceptions for the required applications:
- Open the command prompt as administrator.
- Enter each of the following commands
one at a time with the correct installation path. Press the Enter key after entering
each
command:
New-NetFirewallRule -DisplayName "Programming and Debug Server" -Direction Inbound -Program "<installation path>\Libero_SoC_<version>\Libero_SoC\Designer\bin\prgsrvdmn.exe" -Action AllowNew-NetFirewallRule -DisplayName "Programming Server" -Direction Inbound -Program "<installation path>\Libero_SoC_<version>\Libero_SoC\Designer\bin\prgservapp.exe" -Action AllowNew-NetFirewallRule -DisplayName "Debug Server" -Direction Inbound -Program "<installation path>\Libero_SoC_<version>\Libero_SoC\Designer\bin\dbgservapp.exe" -Action Allow
15.3.2.4.5 Known Issues and Workarounds
(Ask a Question)Issue: In Linux® OS when using FlashPro6 programmers with SmartDebug they become undetectable during the usage. Which will lead to confusion, if you physically see that programmer is attached.
Workaround: If the FlashPro6 programmer is not detected on Linux and you are sure it is connected, wait until the active SmartDebug session releases the programmer or close the session. Once the SmartDebug session ends, the FlashPro6 becomes detectable again.
15.3.2.5 Rescan Programmer
(Ask a Question)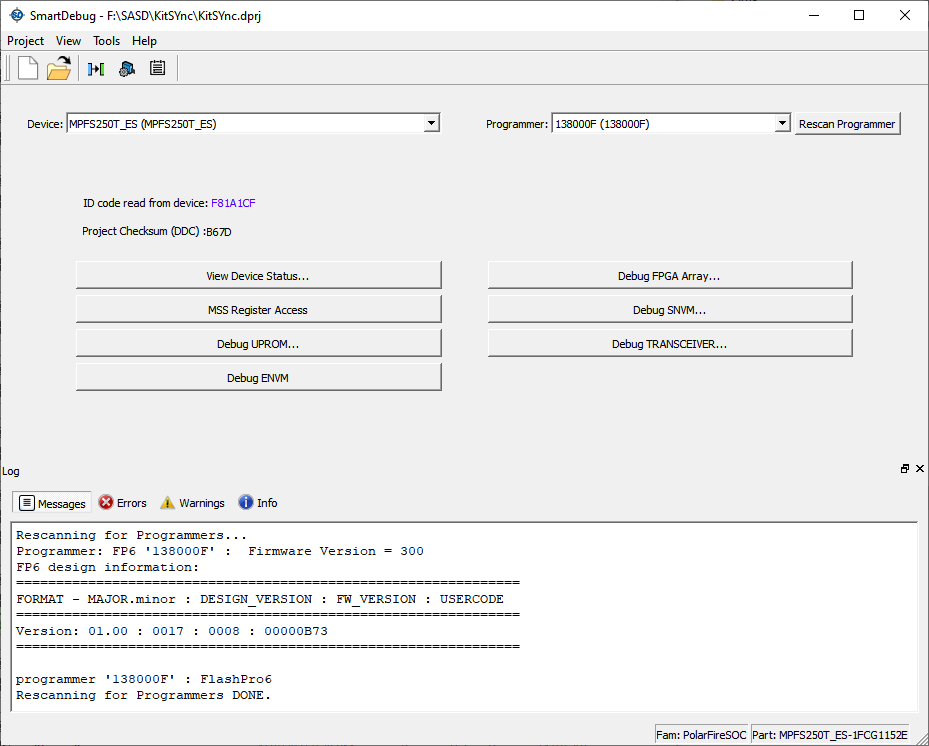
An error is displayed when the programmer is detached from the computer.
