Flash the device and plot the results in the
Data Visualizer. Figure 2-9 shows the results from Burst mode.
Result: Following
the same procedure as explained for Single mode, the result for Burst mode is
plotted in the Data Visualizer:
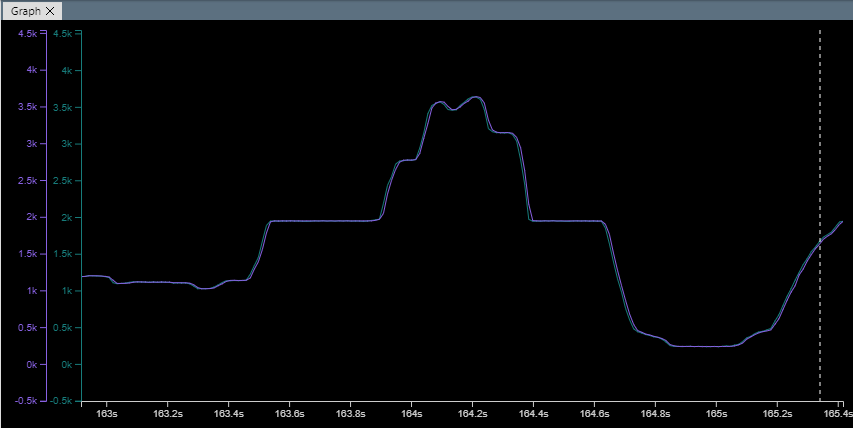
Figure 2-9. Assignment 1: Burst
Mode Plot
The sample-signal in green is the same as for Single mode. It plots the single
conversion held in the sample register. The result-signal in purple will no longer be
the same and will now be an average of the accumulated samples. The plots are still
almost identical except for instances with very sudden changes in input. The difference
is more noticeable when looking at a short time intervals, as shown in Figure 2-9.
The online versions of the documents are provided as a courtesy. Verify all content and data in the device’s PDF documentation found on the device product page.