
1.4 SAMD21 ML Kit Gesture Recognition
Objective Overview
This guide outlines the steps to build a gesture classifier using the MPLAB® Machine Learning Development Suite and to deploy it to the Microchip SAMD21 ML Evaluation Kit, which includes an inertial measurement unit (IMU) sensor. This demo walk-through also provides guidance on designing a data collection process and offers solutions to common issues that may arise during an application's development.
Project Resources
Included with this guide is a fully-developed gesture classifier project. The resources provided include a dataset, a pre-trained machine learning model and firmware source code to facilitate a streamlined project setup using MPLAB® Machine Learning Development Suite and the SAMD21 ML Evaluation Kit.
Procedure:
First, follow the guide to set up the development environment and prepare the SAMD21 ML Evaluation Kit for use.
Next, design an effective data collection process to capture relevant data for training the gesture classifier. Consider factors such as data quantity, quality and diversity to ensure accurate and reliable results.
Use the MPLAB® Machine Learning Development Suite to create and train a machine learning model using the collected data.
When the model is trained, deploy it to the SAMD21 ML Evaluation Kit and evaluate its performance.
If necessary, refine the model and repeat the process until the desired accuracy is achieved.
Hardware:
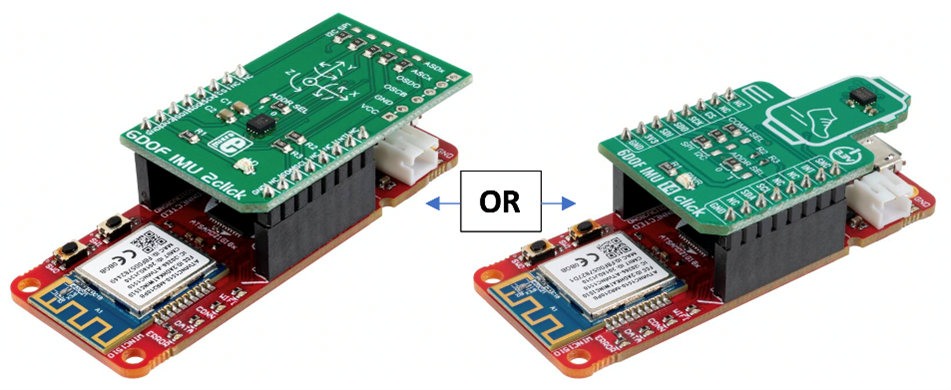
SAMD21 Machine Learning Evaluation Kit with BOSCH IMU or with TDK IMU
Software Tools:
MPLAB X IDE( Integrated Development Environment)(v6.05 or later)
MPLAB® Machine Learning Development Suite
ML Data Collector
ML Model Builder
Exercise Files
The firmware, Data-collection firmware, dataset used in this tutorial and MPLAB X project files can be found in the GitHub repository.
Procedure:
Before starting, you will need to install and set up the required software as detailed in the steps below.
Install the MPLAB X IDE (Integrated Development Environment) and XC32 compiler. These are required to load the gesture recognition project and to program the SAMD21 board. You can use the default free license for the XC32 compiler, as the pro functionality is not needed for this project.
Install ML Data Collector and the ML Model Builder plug-ins in MPLAB X IDE.
Log in to the ML Model Builder plug-in with your myMicrochip credentials to create a free account.
Finally, go to the Microchip GitHub site for this project, then download the
ml-samd21-iot-mplabml-gestures-demo.ziparchive, which contains the dataset and pre-built firmware binaries for this guide.
Flashing the Gesture Classifier Demo Firmware
We are now set up to run pre-built firmware. Program your device with the firmware HEX file from the latest GitHub release using the following steps.
Plug your SAMD21 evaluation kit into your PC via USB (Universal Serial Bus). The SAMD21 will automatically come up as a USB Flash drive.
Open the
ml-samd21-iot-mplabml-gestures-demo.ziparchive downloaded previously, then locate the gesture classifier demo HEX file corresponding to your sensor make:Bosch IMU:
binaries/samd21-iot-mplabml-gestures-demo_bmi160.hexTDK IMU:
binaries/samd21-iot-mplabml-gestures-demo_icm42688.hex
Drag and drop the HEX file onto the SAMD21 USB drive to program the device.
Gesture Classifier Firmware Overview
To obtain information on the demo firmware included with this project, which encompasses its operation, usage and benchmarks, refer to the README section located in the GitHub repository associated with this project.
Data Collection Overview
Before starting data sample collection, carefully plan the design of the data collection process. It is crucial to recognize that the quality of the data gathered will directly impact the performance of the Machine Learning model.
Data Collection: Sensor Configuration
The first step in the data collection process is to determine the optimal sensor configuration for the application. This involves determining the physical placement and installation of the sensor and signal processing parameters, such as sample rate and sensitivity.
While some design parameters may be fixed, it is advisable to consider whether the application design is ideal for the Machine Learning task and if some design parameters need to be modified. It is important to determine whether it is feasible to anticipate an algorithm predicting the desired output based on the sensor data input.
During the sensor configuration stage, it is recommended to ask specific questions, such as how the sensor sampling parameters need to be configured (i.e., sample rate, sensitivity/input range), how the sensor needs to be placed (i.e., mounting and orientation) and how the sensor needs to be fixed.
In this project, the following sensor configuration parameters were chosen: accelerometer only, 100 Hz sample rate and 16G accelerometer range. The accelerometer-only configuration was selected because the chosen gestures were expected to be mostly invariant to device rotations. A sample rate of 100 Hz was selected for flexibility in the data collection process, even though the gestures had a frequency range of typically <5 Hz (i.e., 10 Hz Nyquist rate). The least sensitive setting of the 16G accelerometer range was chosen because micro-movements were not of interest.
Data Collection: Collection Protocol
The following describes the second step of the data collection process, which involves developing a protocol for data collection.
The primary goals of the protocol are as follows:
To establish a reproducible methodology for data collection
To determine appropriate sampling parameters that provide enough sample numbers and diversity for model development and generalization
To include metadata variables that capture known variances between samples
Establishing a reproducible methodology ensures that data collection is performed consistently with minimal variations between measurements, which guarantees the integrity of the data. Determining appropriate sampling parameters requires selecting an adequate number of samples for each class of event, considering the variance between the samples and capturing enough metadata variables to trace the data samples later.
A good rule of thumb is that at least ten samples are needed for each class of event you want to classify (30 is a good starting point); however, this number may increase depending on the variance between the samples. Taking the gestures application as an example, if you wanted to detect a circle gesture but wanted your model to be invariant to the size or speed of the circle gesture, you would need many more samples to cover the range of performances. Another thing to consider when selecting a sample size is that you will invariably capture noise (i.e., unintended variances) in your samples; the hope is that with enough samples, the training algorithm will have enough information to learn to discriminate between the signal of interest and the noise. A word to the wise: start small! Anticipate that the development of your data collection process will require some iteration: refine your process first, then start scaling up.
Benefits of Metadata Variables
Metadata variables, also known as tags, are breadcrumbs left by the user to trace their data samples. These tags provide several benefits, including:
Exploring subgroups within data: Metadata variables can be used to identify subgroups within data. For example, all gestures performed by a single test subject can be identified using metadata variables. This is useful when analyzing large datasets and identifying patterns or trends within specific subgroups.
Tracking data issues: Metadata variables can be used to track down any data issues that may arise later. For instance, if there are hardware problems or outlier samples, metadata variables can aid in identifying which samples are affected. This helps to minimize the impact of such issues on the overall analysis.
In the context of this demonstration project, Microchip has developed a data protocol document outlining the guidelines for executing gestures and collecting corresponding metadata. Below are the instructions that dictate the performance of gestures by the test subjects. The italicized text denotes the specific experimental parameters that are rigidly controlled by Microchip.
Subject performs gestures that follow the specified trajectory description (e.g., clockwise wheel).
Subject performs gestures smoothly, in a way that feels natural to them.
Subject performs gesture continuously for at least seconds.ten.
Subject is standing.
Subject uses hand.dominant.
Subject holds the board with a thumb and forefinger grip with the cord facing down as shown in Figure 2.
Data Collection: Data Capture Tools
For this guide, we will be using the pre-built dataset included with the gestures demo, but to build your dataset you can use the MPLAB X Data Visualizer and MPLAB® Machine Learning Development Suite.
To use the ML Evaluation Kit with MPLAB Data Visualizer, you will need to use the data logger
firmware maintained on the SAMD21 IOT IMU Data Logger page. For convenience, pre-built binaries for the
sensor configuration used in this project are packaged in the
ml-samd21-iot-mplabml-gestures-demo.zip archive included in the Github release:
Bosch IMU:
binaries/samd21-iot-data-visualizer_bmi160_100hz-axayzgxgygz-16g-2000dps.hexTDK IMU:
binaries/samd21-iot-data-visualizer_icm42688_100hz-axayzgxgygz-16g-2000dps.hex
Model Data upload to ML Builder
When dealing with a sizable collection of files within a dataset, utilizing the MPLAB ML SDK (Software Development Kit) to upload the files may be a simpler option. Refer to the MPLAB ML SDK for descriptions of the APIs. By employing the SDK, users can conveniently upload labeled data to the Data Manager.Model Development
To generate our classifier model, proceed to MPLAB® Machine Learning Development Suite.
The process for accessing the Microchip MPLAB® Machine Learning Development Suite requires the following steps:
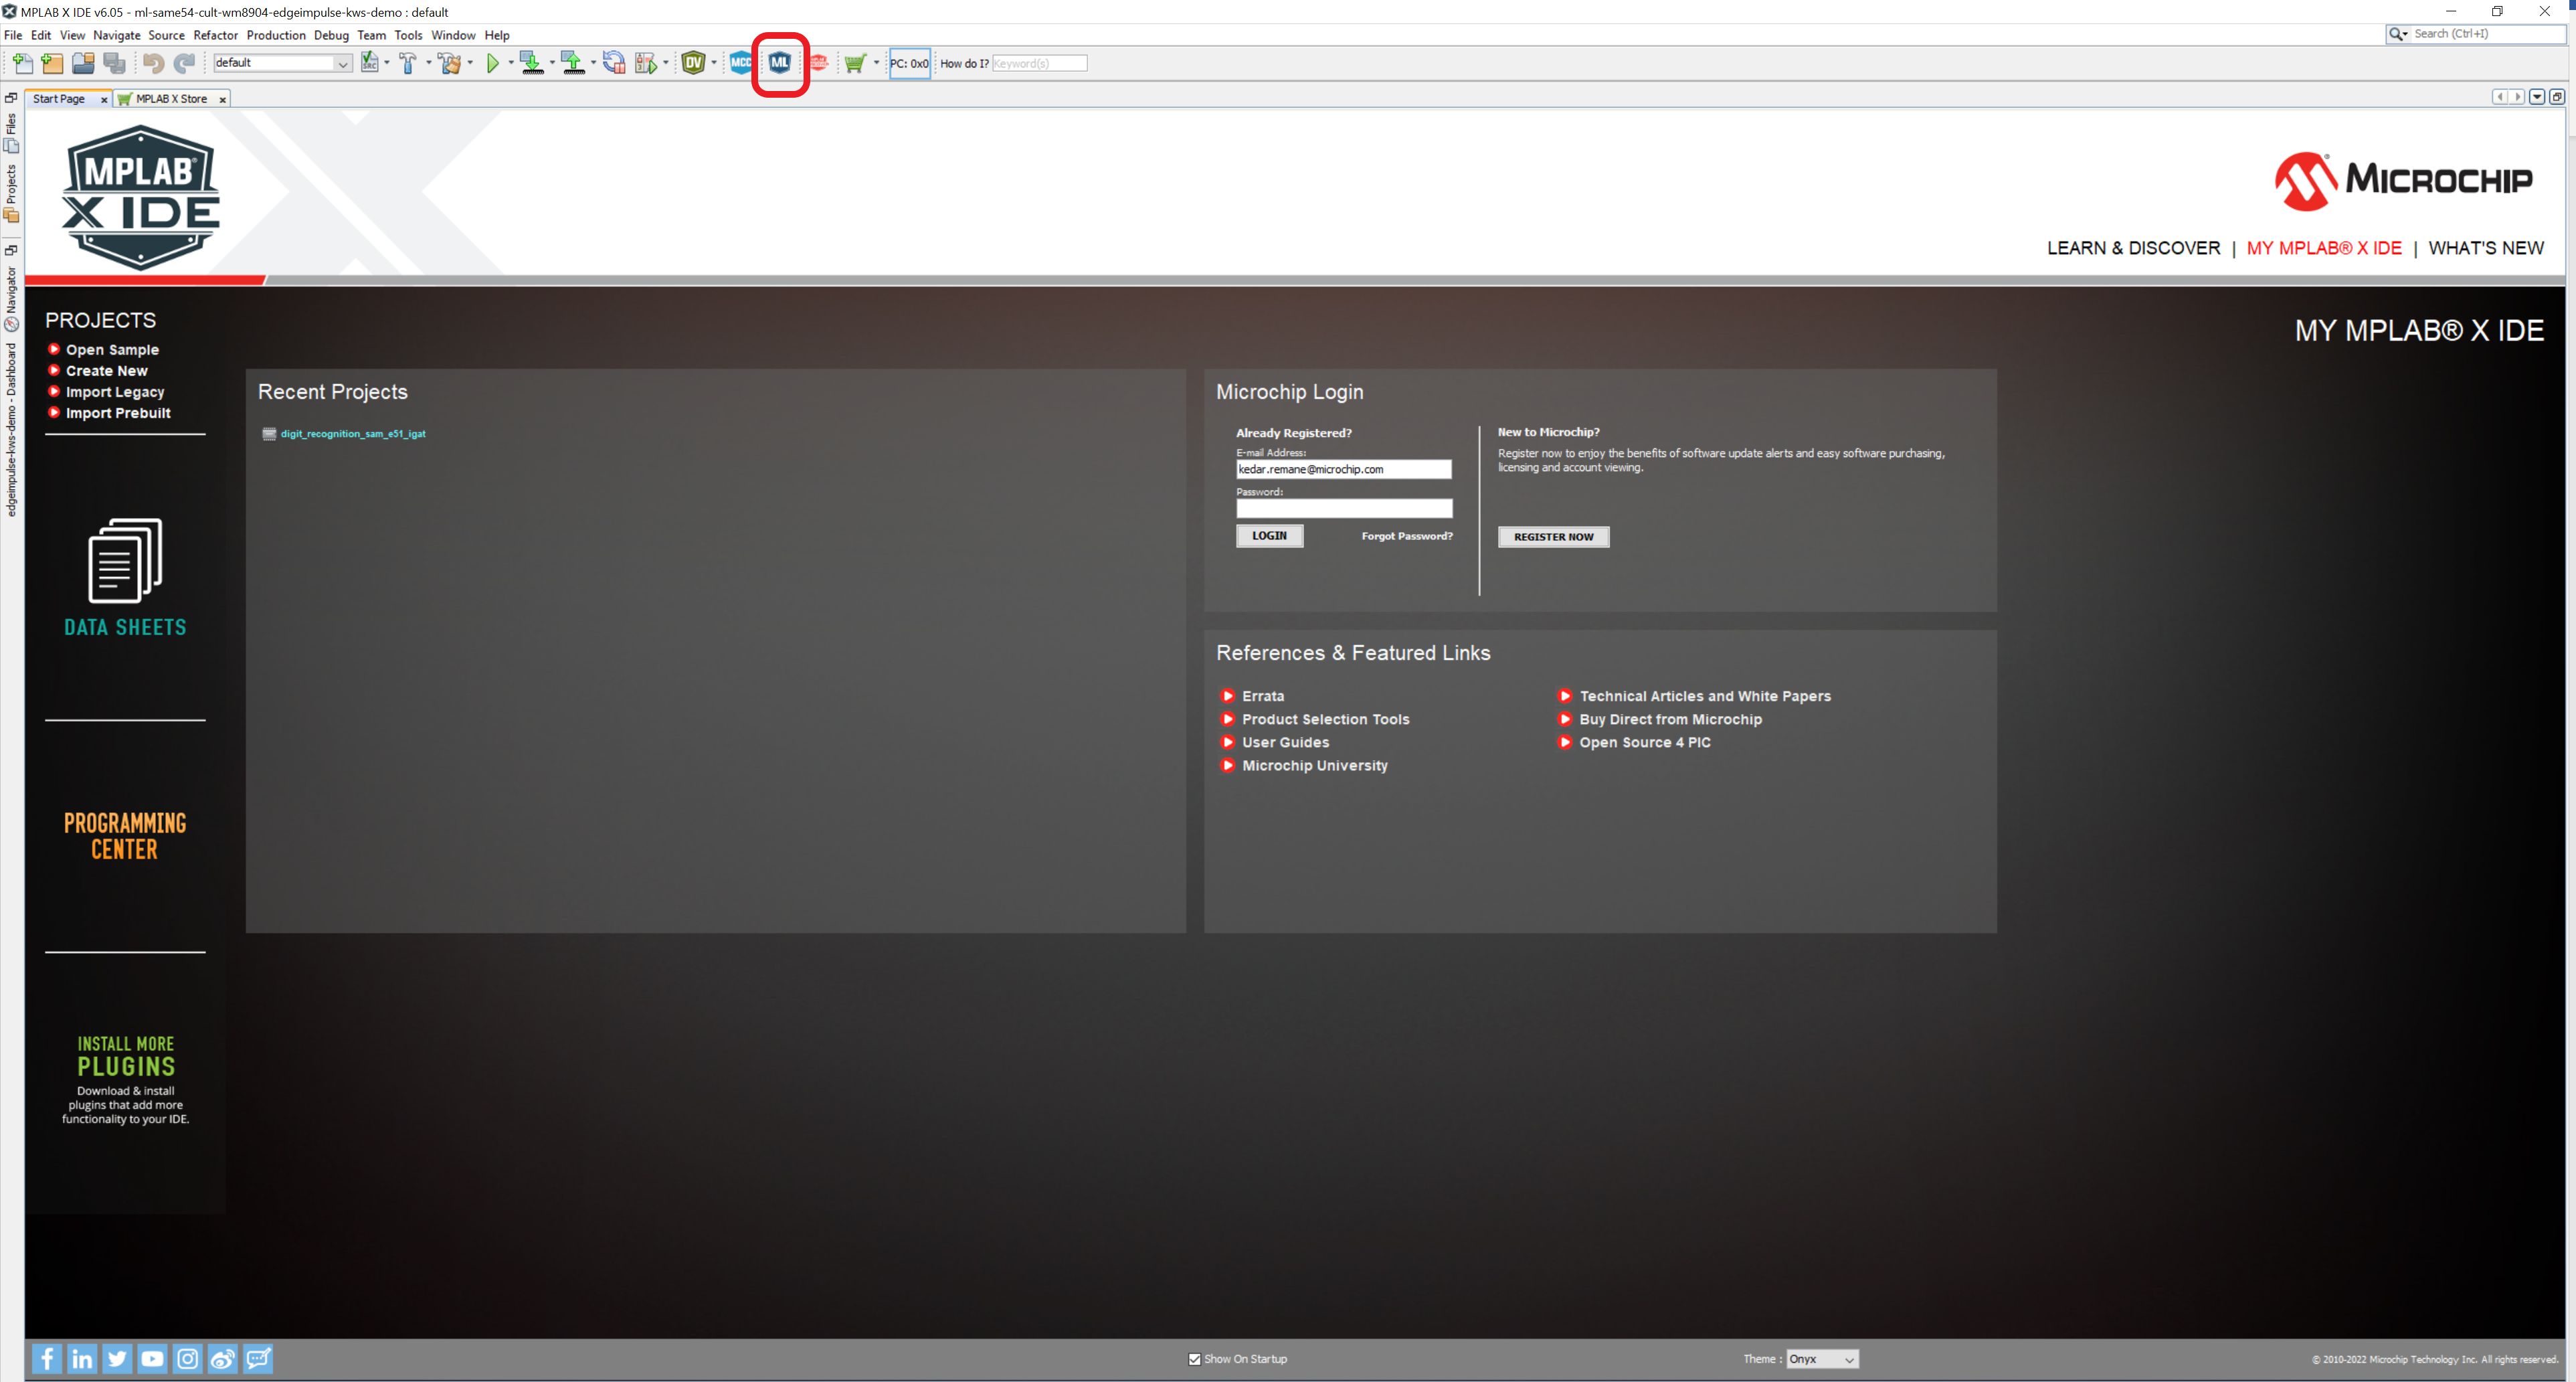
Launch the MPLAB X IDE software.
Next, launch the ML Model Builder tool.
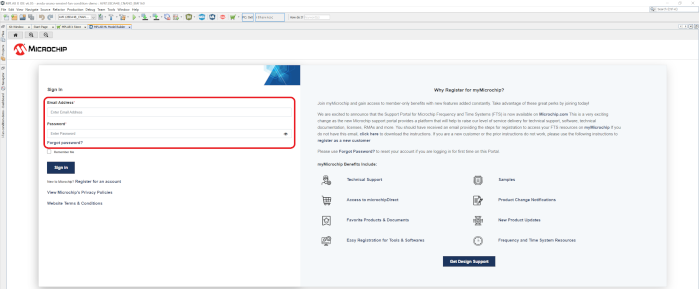
When the ML Model Builder page loads, users are prompted to authenticate their account by entering their myMicrochip login credentials.
Upon accessing the system, users are directed to the login page where valid login credentials linked to their Microchip account need to be provided to proceed. When users are successfully logged in, they are granted access to their Microchip account along with all the associated functionality available within the system.
Upon successful login, the user may proceed to initiate a new project by selecting the CREATE PROJECT tab. This action triggers a pop-up window prompting the user to specify a name for the new project.
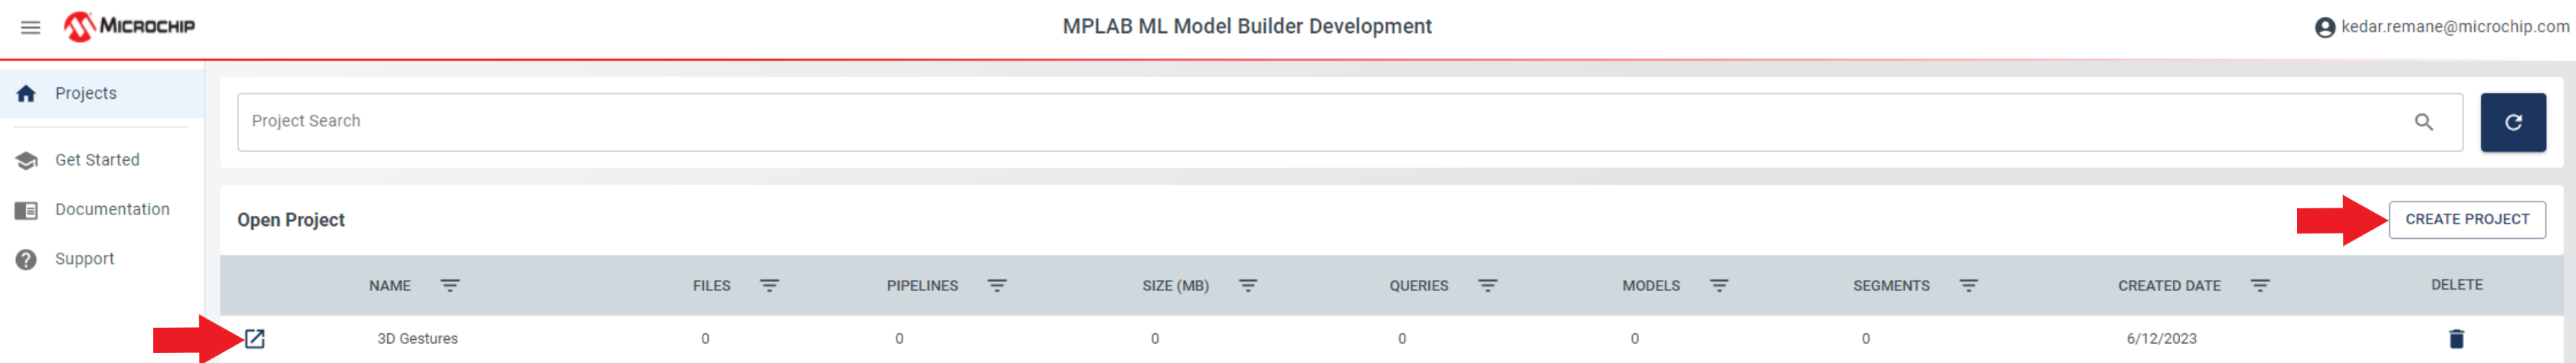
To open the project, locate the Open Project button positioned before the project name, then click it.
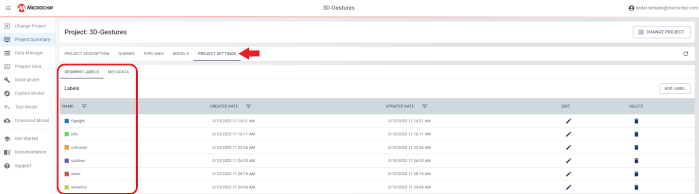
To create new labels and metadata fields for a project, follow these steps:
Go to the Project Summary page.
Click Project Settings.
You will see two menu items: Segment Labels and Metadata.
To create new labels and metadata fields, click the ADD LABEL and ADD METADATA buttons located in the top right corner of the page.
Fill in the required information for the new label and metadata fields.
Click SAVE to create the new label and metadata fields.
Repeat steps 3-5 for each additional label or metadata field that you want to create.
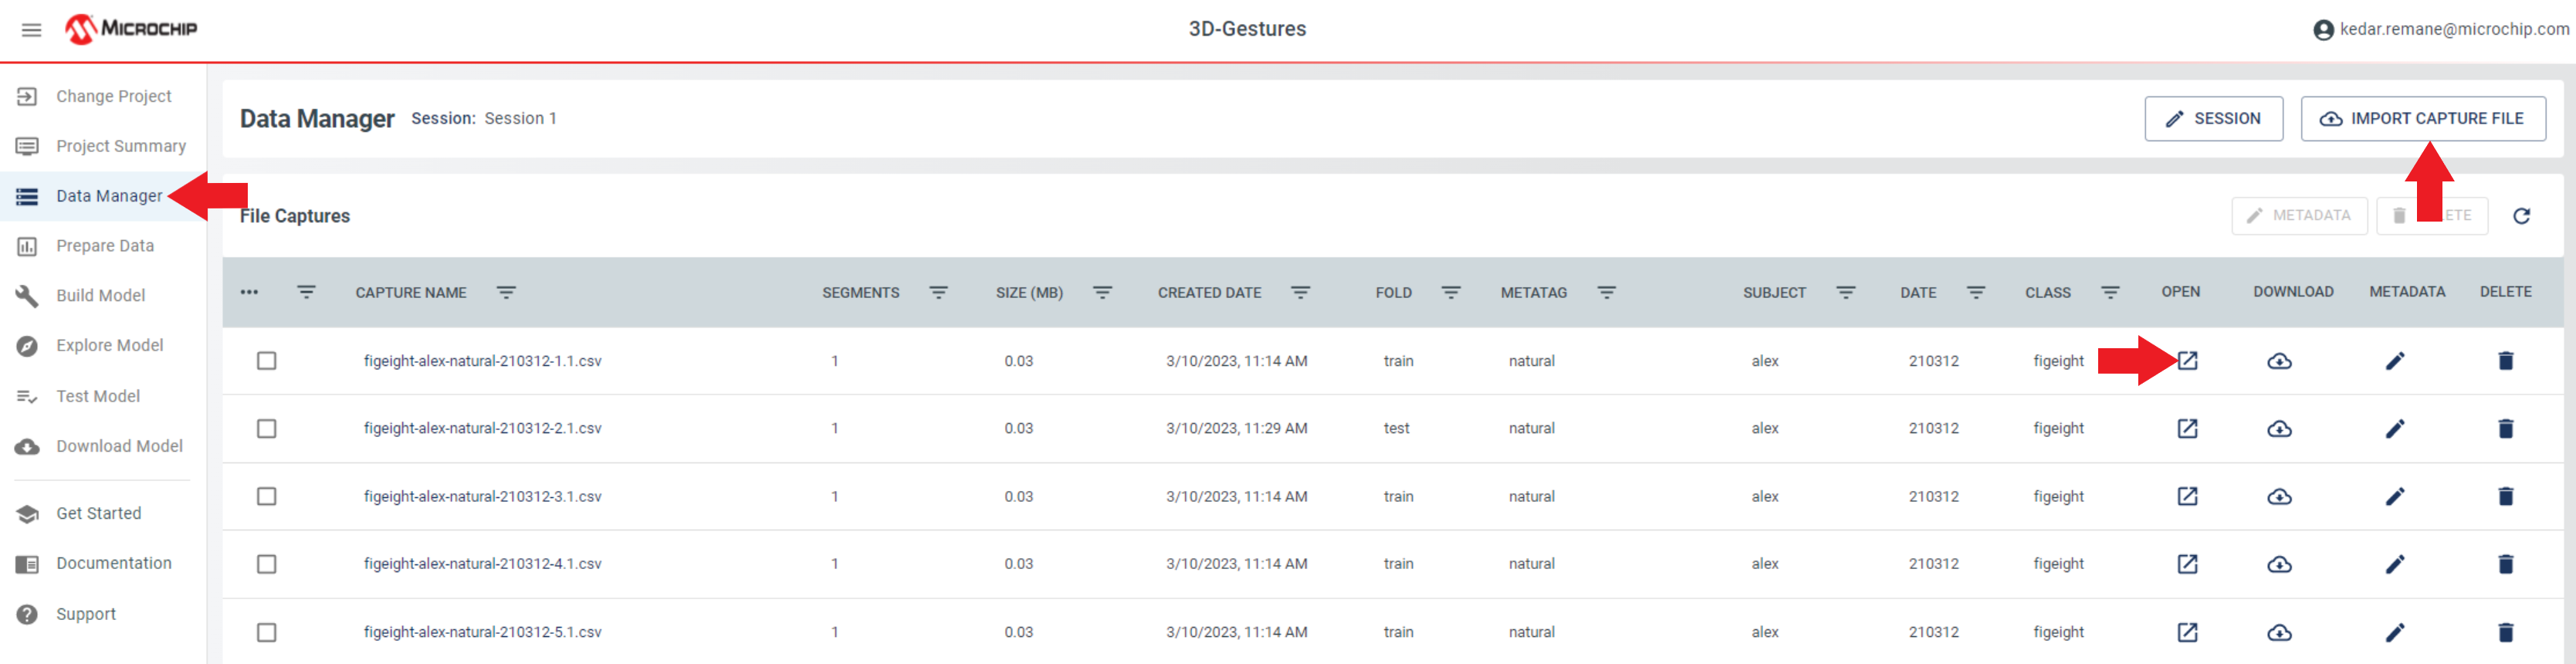
Next, moving onto the Data Manager Module, to import necessary data files for the project, follow these steps:
Navigate to the Data Manager tab.
Locate the IMPORT CAPTURE FILE button, then click it.
Ensure that the data files to be imported are in either CSV or .wav format.
Select all the files required for the project.
Begin the import process.
When the import process is complete, the imported data files will be available for use in the project. It is important to ensure that all data files are properly formatted and labeled to ensure accurate analysis and interpretation of the project results.
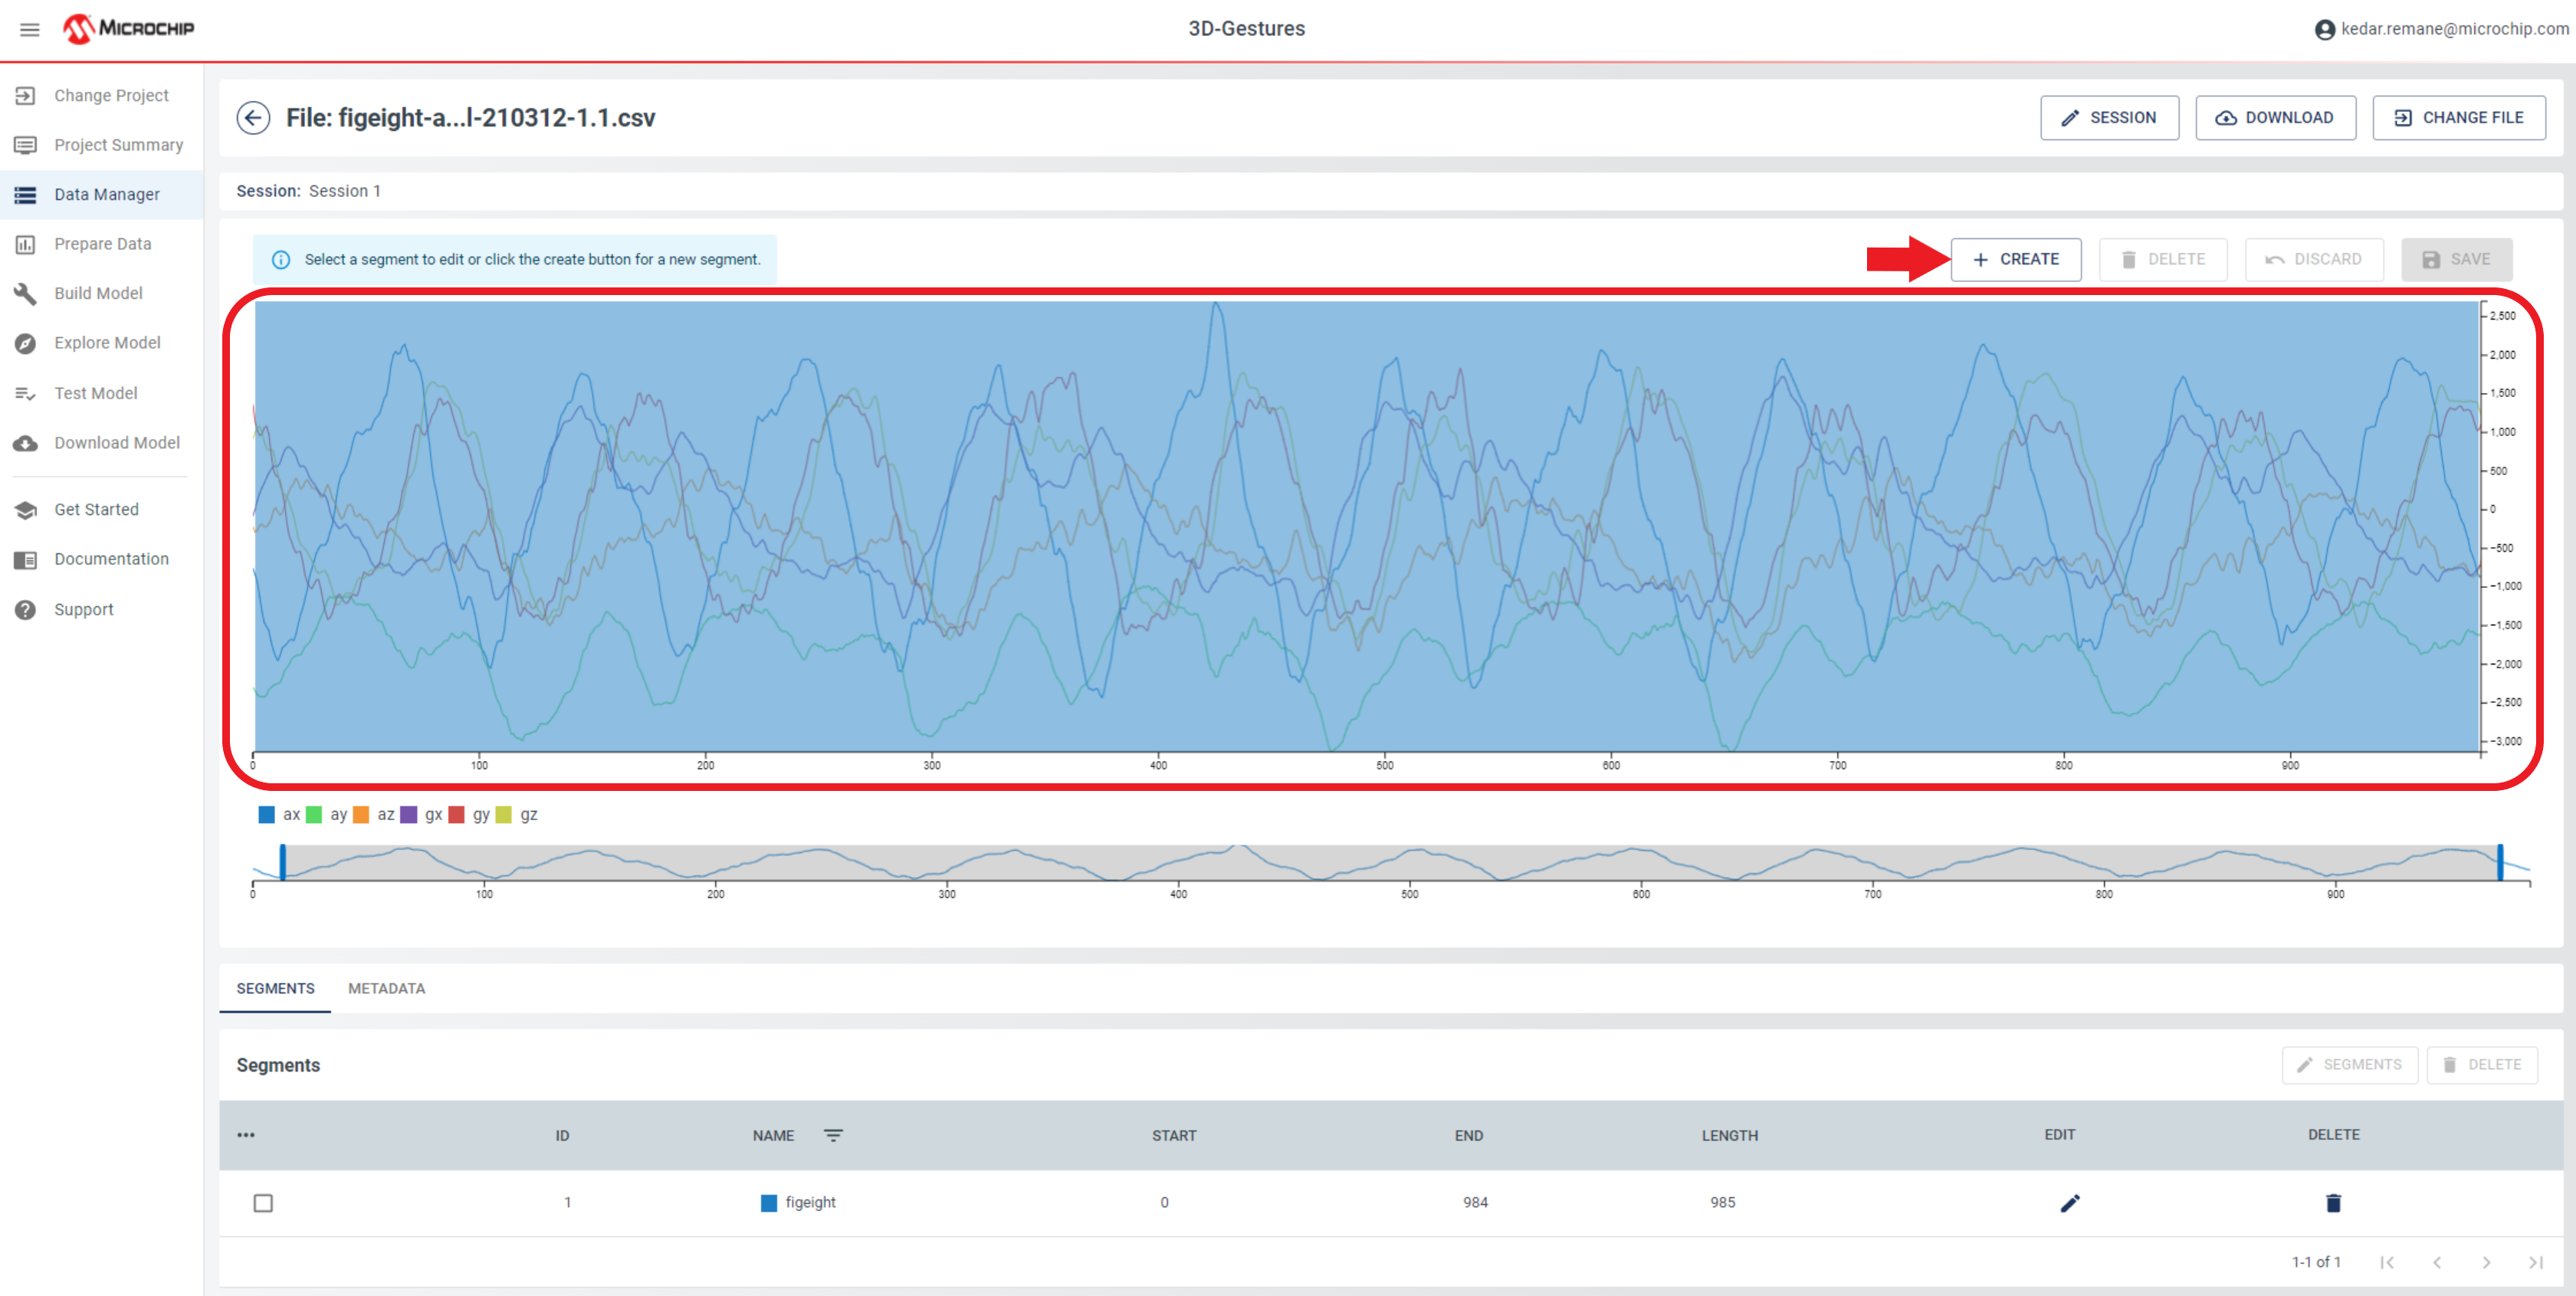
To access the imported data files, click the icons corresponding to the desired file under the Open column. When the desired file opens, navigate to the CREATE button to begin segmenting the data. To create segments, drag the segments axis to the desired locations within the data.
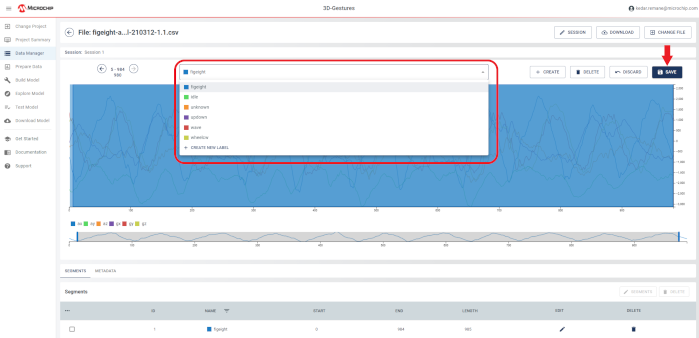
It is, then, recommended to correctly categorize these segments using appropriate labels and metadata fields for ease of organization and future analysis.
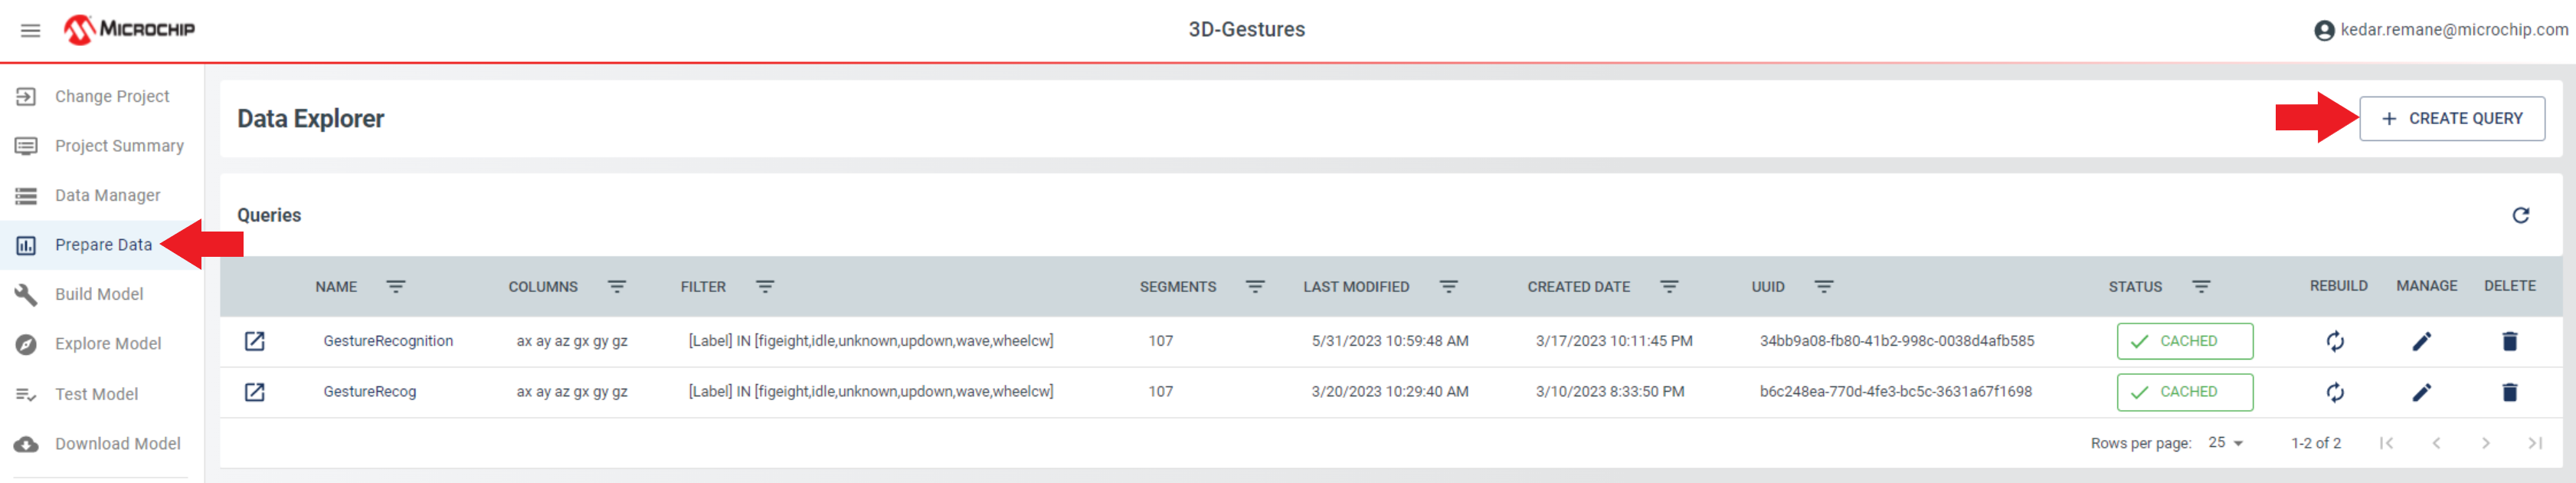
To proceed, navigate to the Prepare Data tab. From there, locate, then click the CREATE QUERY button to initiate the data preparation process.
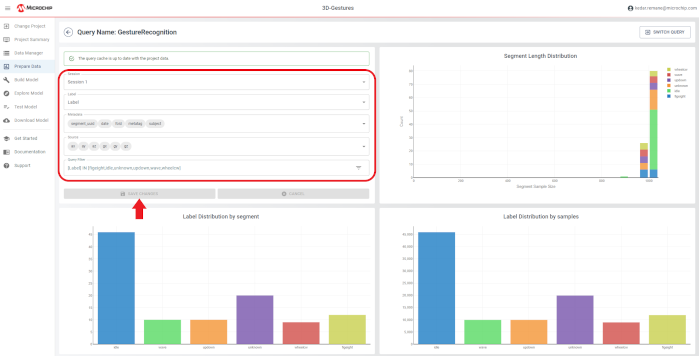
Fill out the block as displayed above.
Click the CACHE button to initiate the caching process.
Wait for the cache to build out completely.
Click the SAVE button when the cache is fully built.
By following these steps, the block will be saved with the cached information.
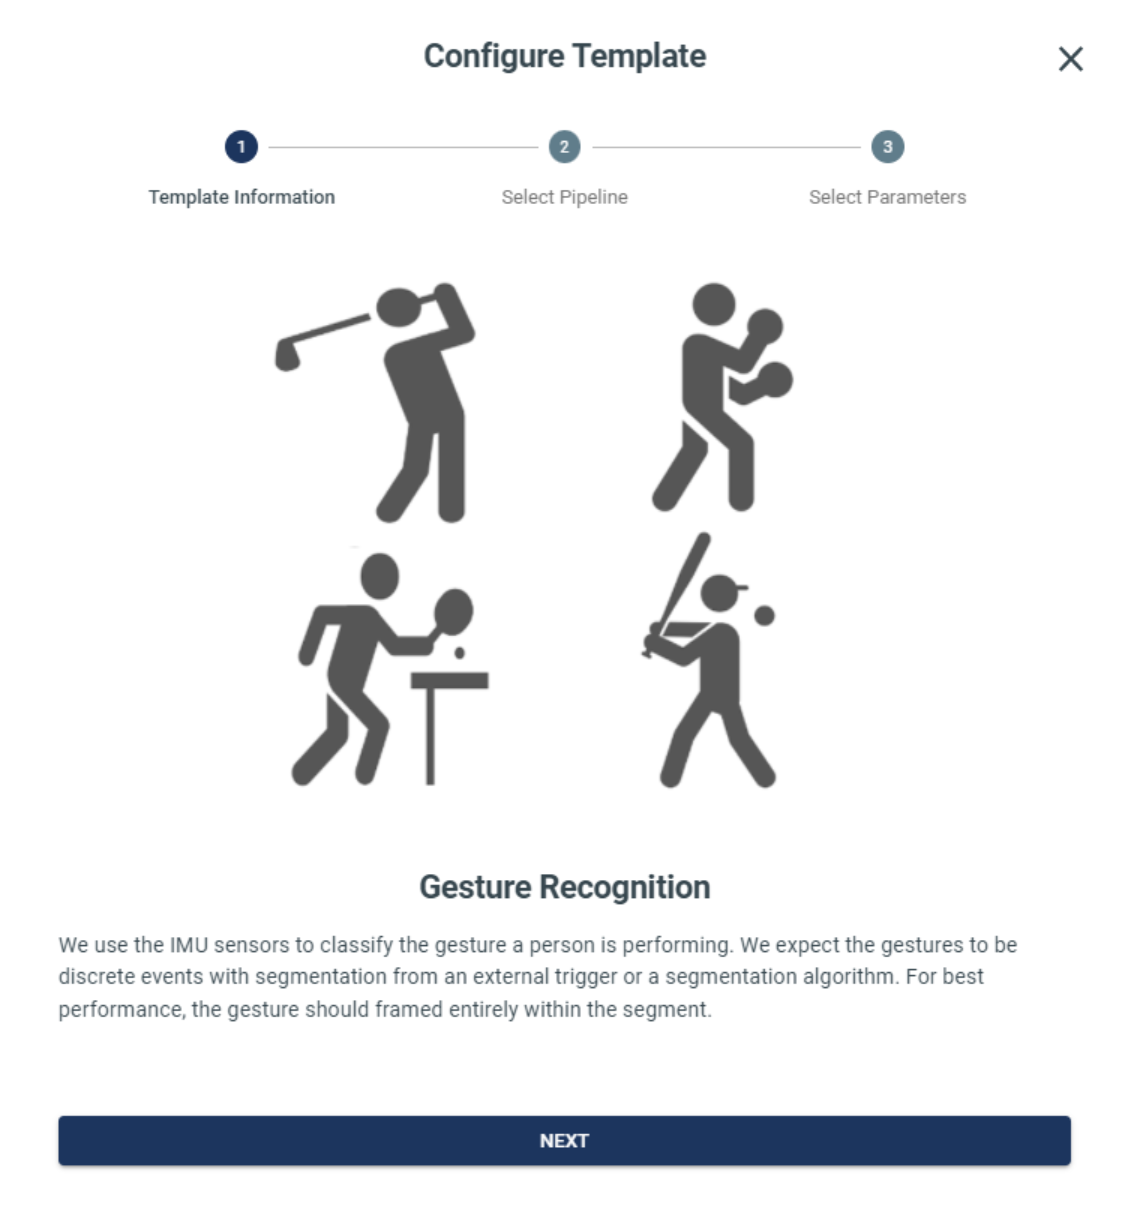
Next, navigate to the Build Model module, then click on the templates available. Here, select the Gesture Recognition Pipeline Template.
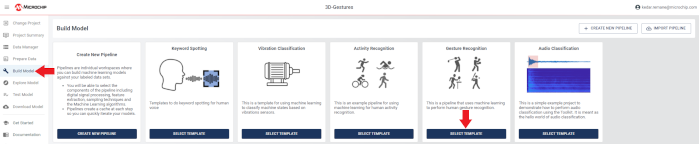
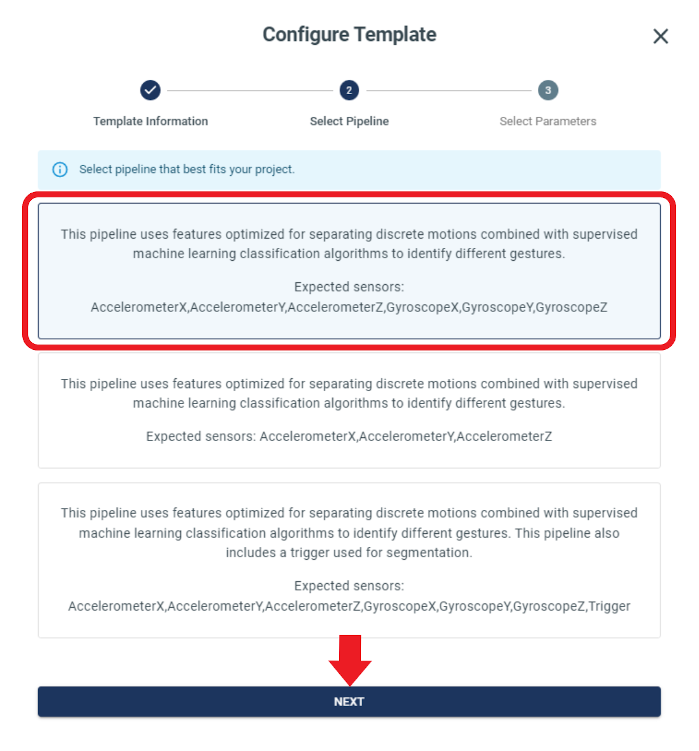
Next, it will ask you to choose between the three pipeline options depending upon the sensors and axis that it expects to have in the data files. Depending on the data format, choose the appropriate option.
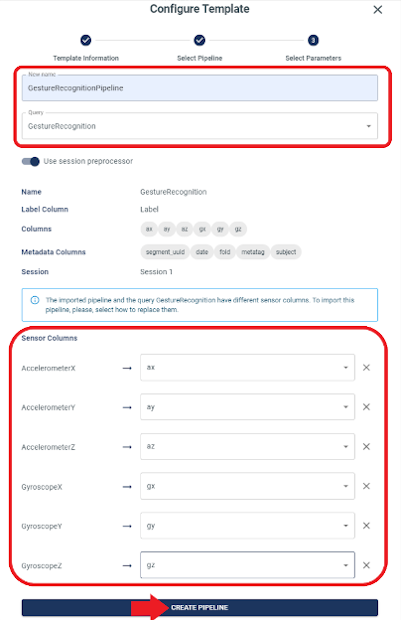
After clicking on next, it will require you to name your pipeline. Enter a name for your pipeline, then make sure you select the query that you created in the previous module. It will also ask you to enter the corresponding column name for the sensor in the data file. Click CREATE PIPELINE when everything is filled out as shown below.
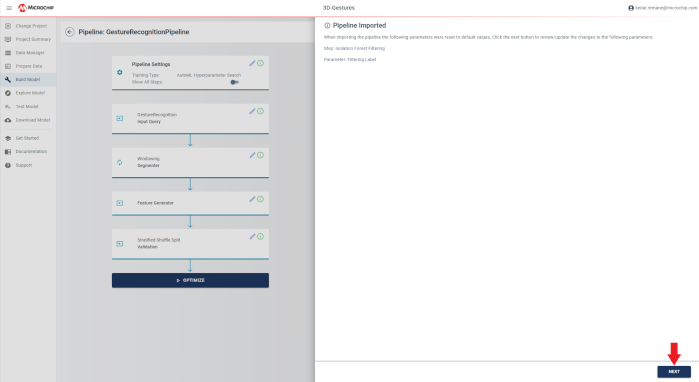
After clicking the CREATE PIPELINE button, another pop-up displays with the details regarding the pipeline. Click NEXT.
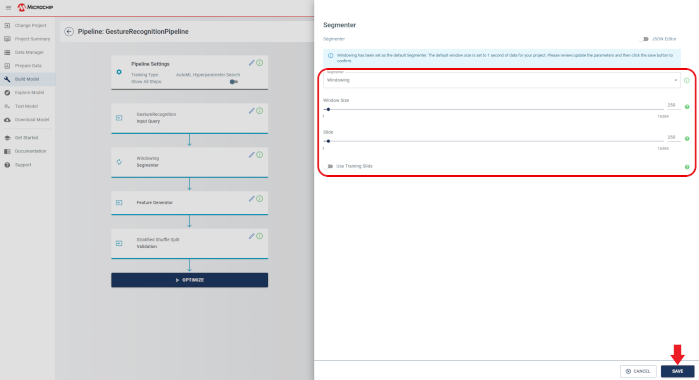
Next, it displays a segmenter module where the user is required to do the following:
Set the parameters as depicted in the figure below to ensure the appropriate segmentation of the data.
After setting the parameters, click the SAVE button to save the changes.
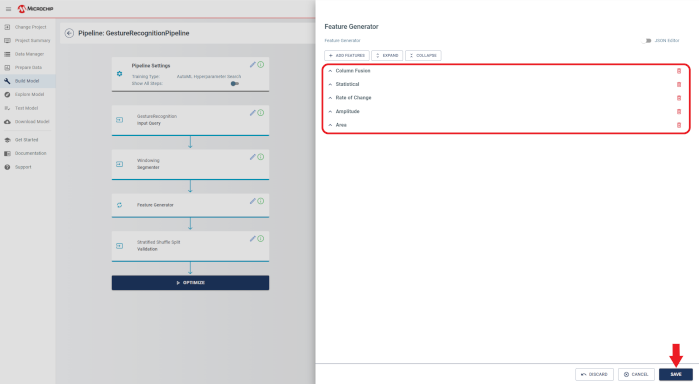
In the Feature Generator Module, review the selected features. It is imperative to verify that all features mentioned in the list below are selected. Additional features can be added by clicking the ADD FEATURES button if desired.
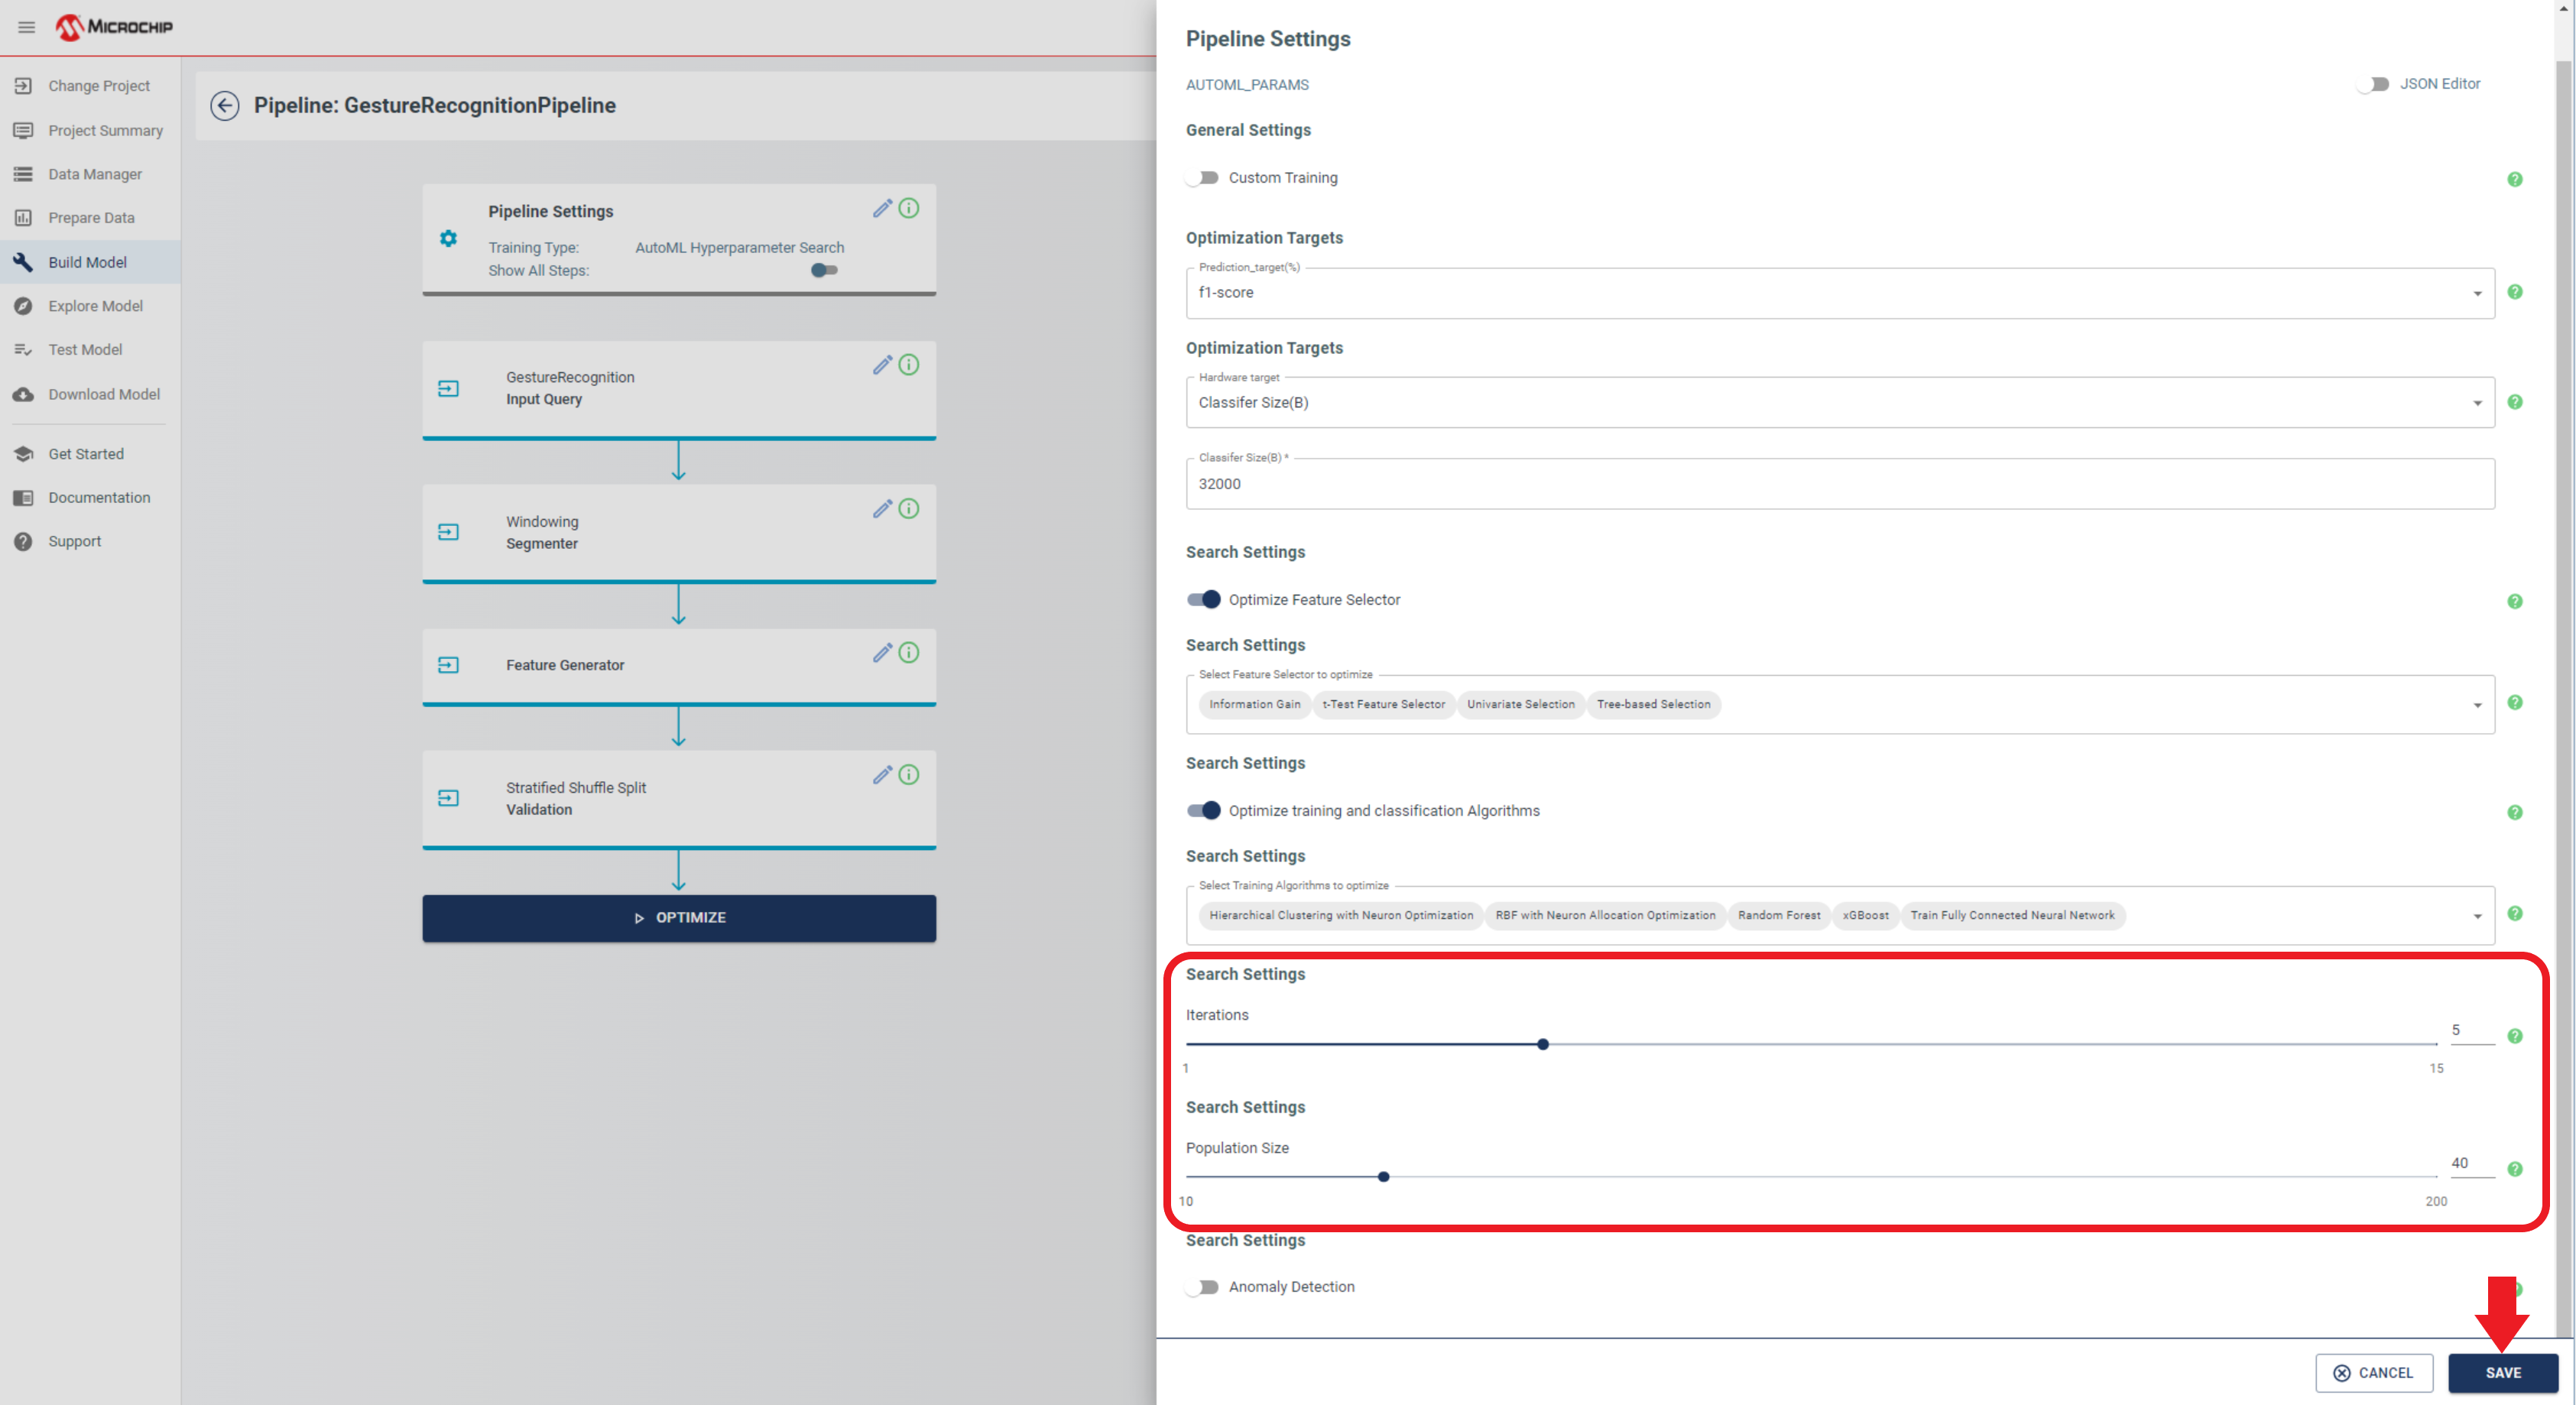
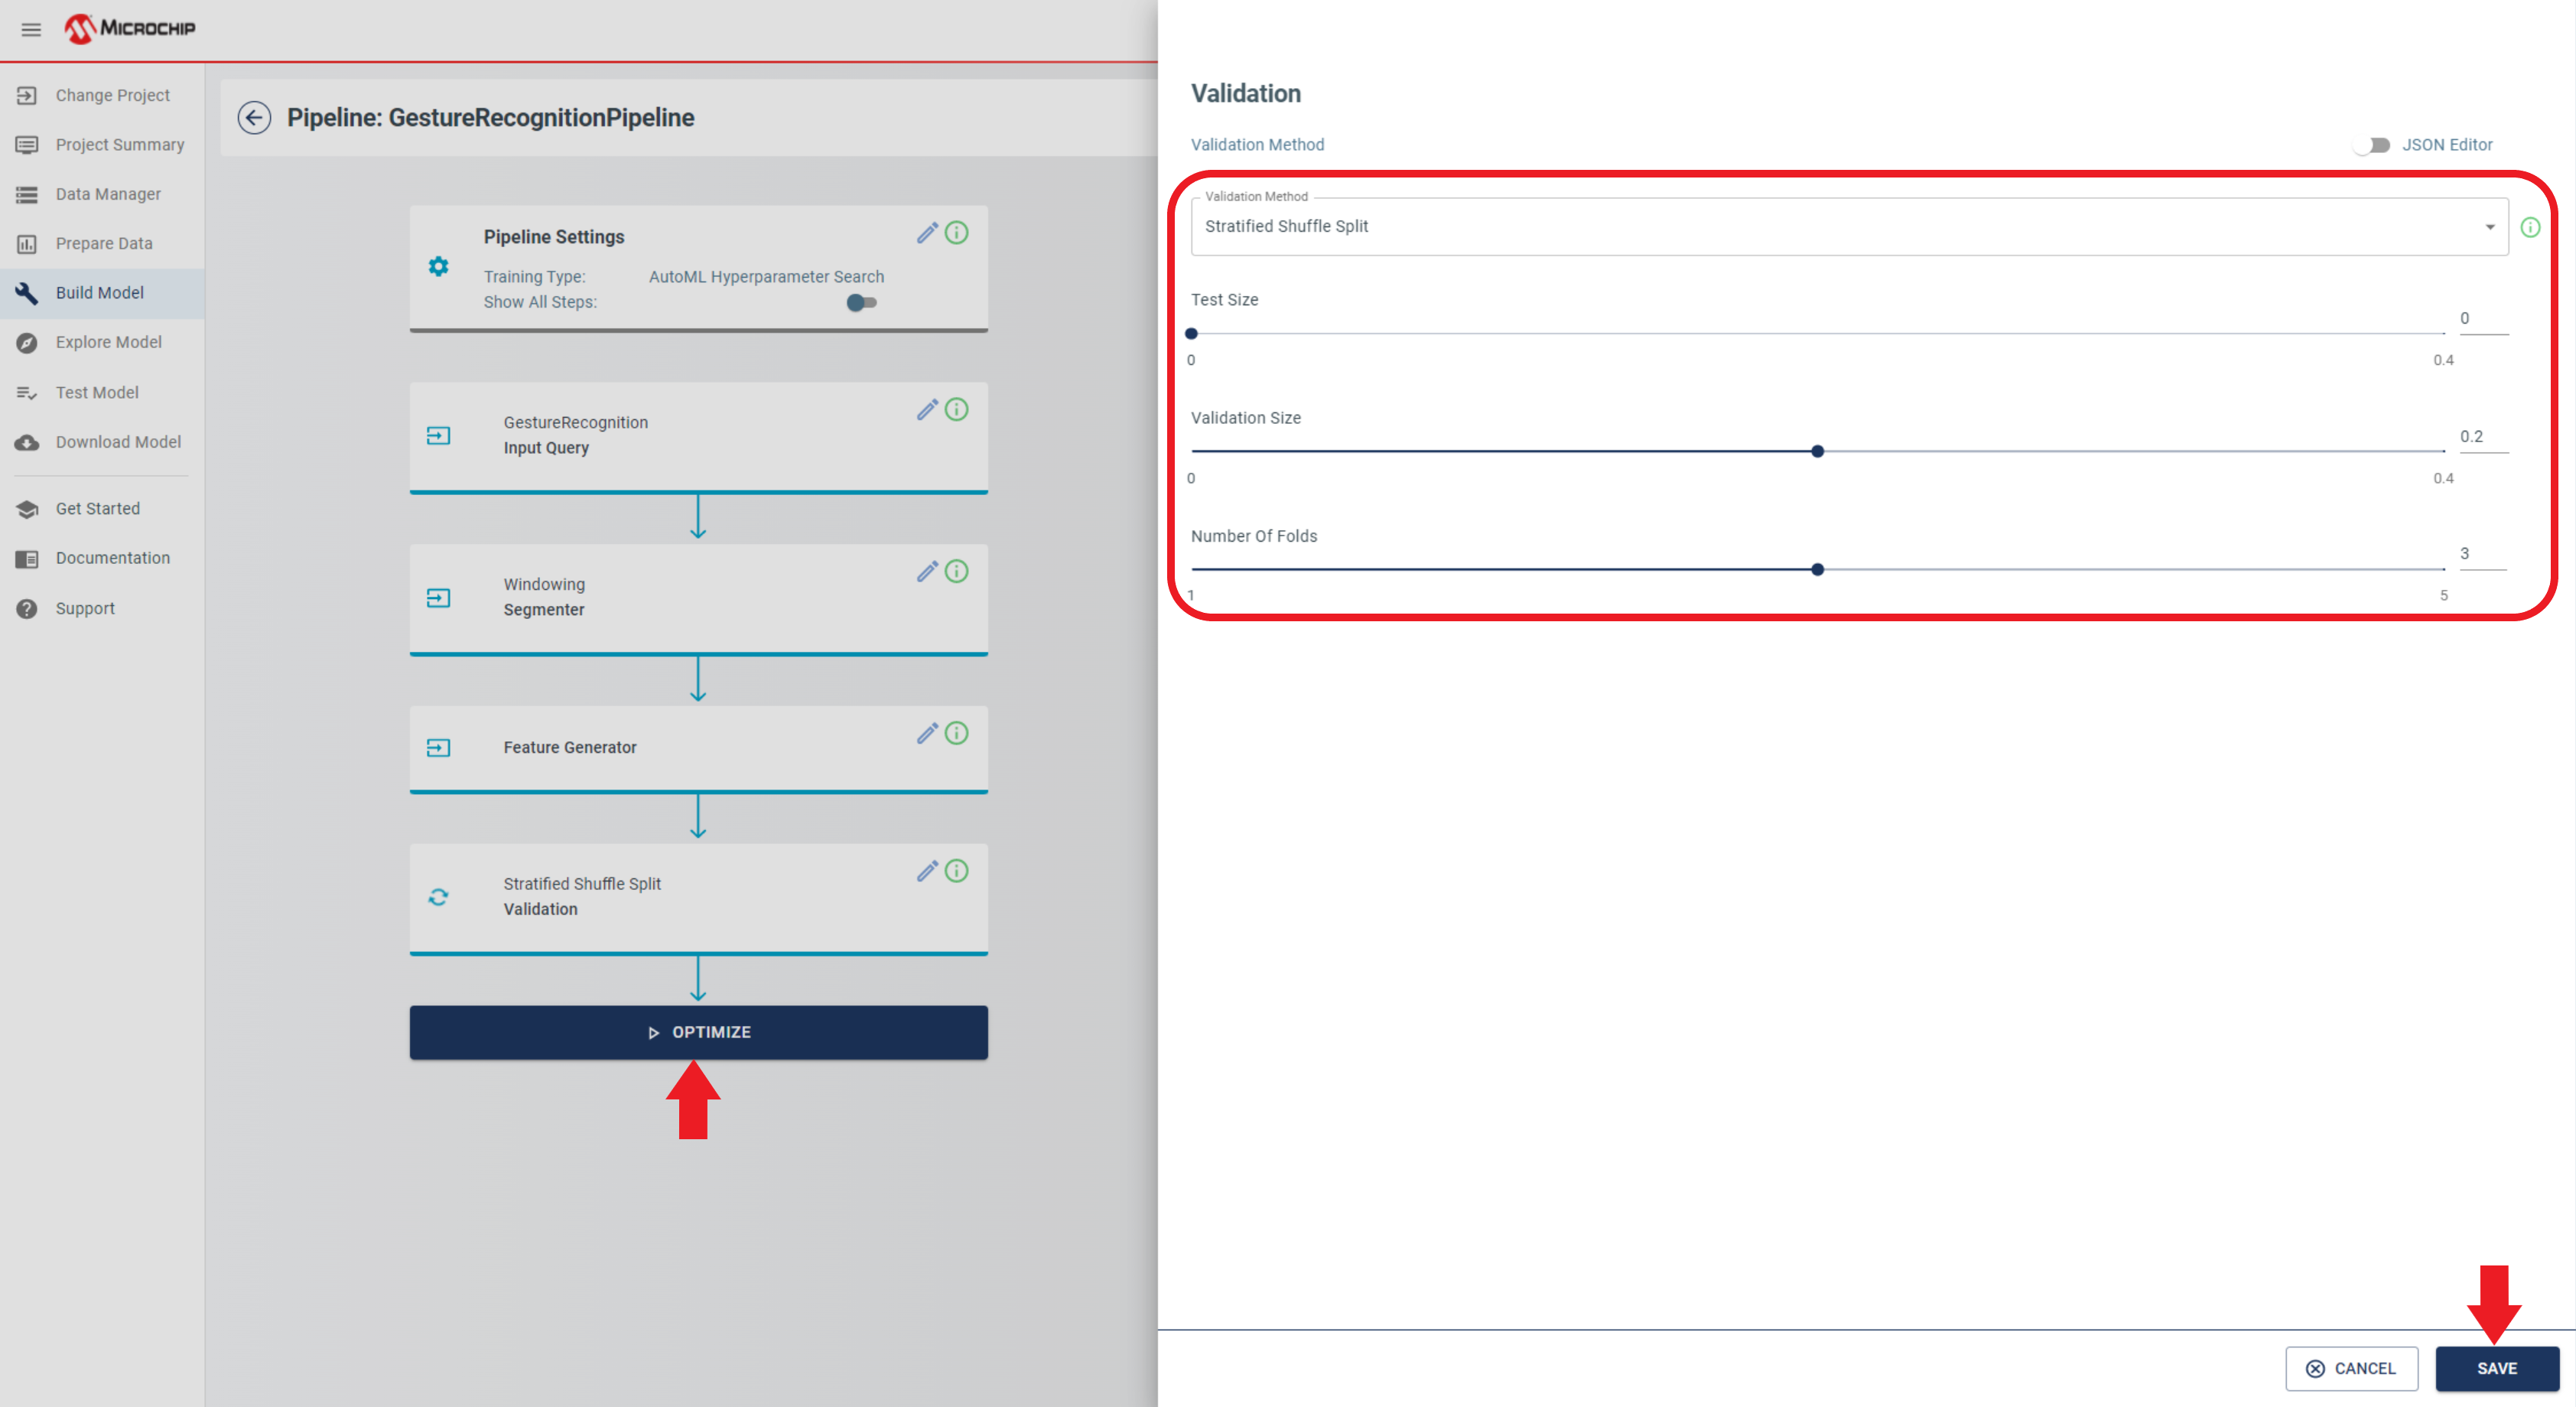
To complete the configuration process, navigate to the Pipeline Settings area. Verify that all parameters are configured according to the parameters shown in the figure below. Click the SAVE button to save the settings.
Lastly, proceed to the Validation module. Select the appropriate validation method based on the project requirements. When the validation method is chosen, specify the Test Size, Validation Size and the Number of Folds to be used for the validation process. After providing these inputs, click the SAVE button to save the changes made to the validation module.
The final step is to click the OPTIMIZE button. The AutoML techniques will automatically select the best features and machine learning algorithm for the gesture classification task based on the input data you provided. Note that this optimization process typically takes several minutes to complete.
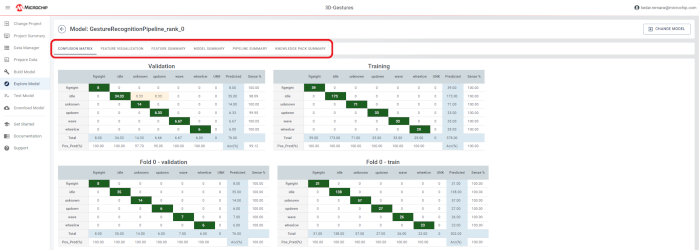
After completing the process of Model Optimization, proceed to the Explore Model tab. In this tab, the top five models displayed will be ranked based on their ability to produce optimal outcomes. To access additional information regarding each individual model, click the open model icon that is located to the left-hand side of its respective name.
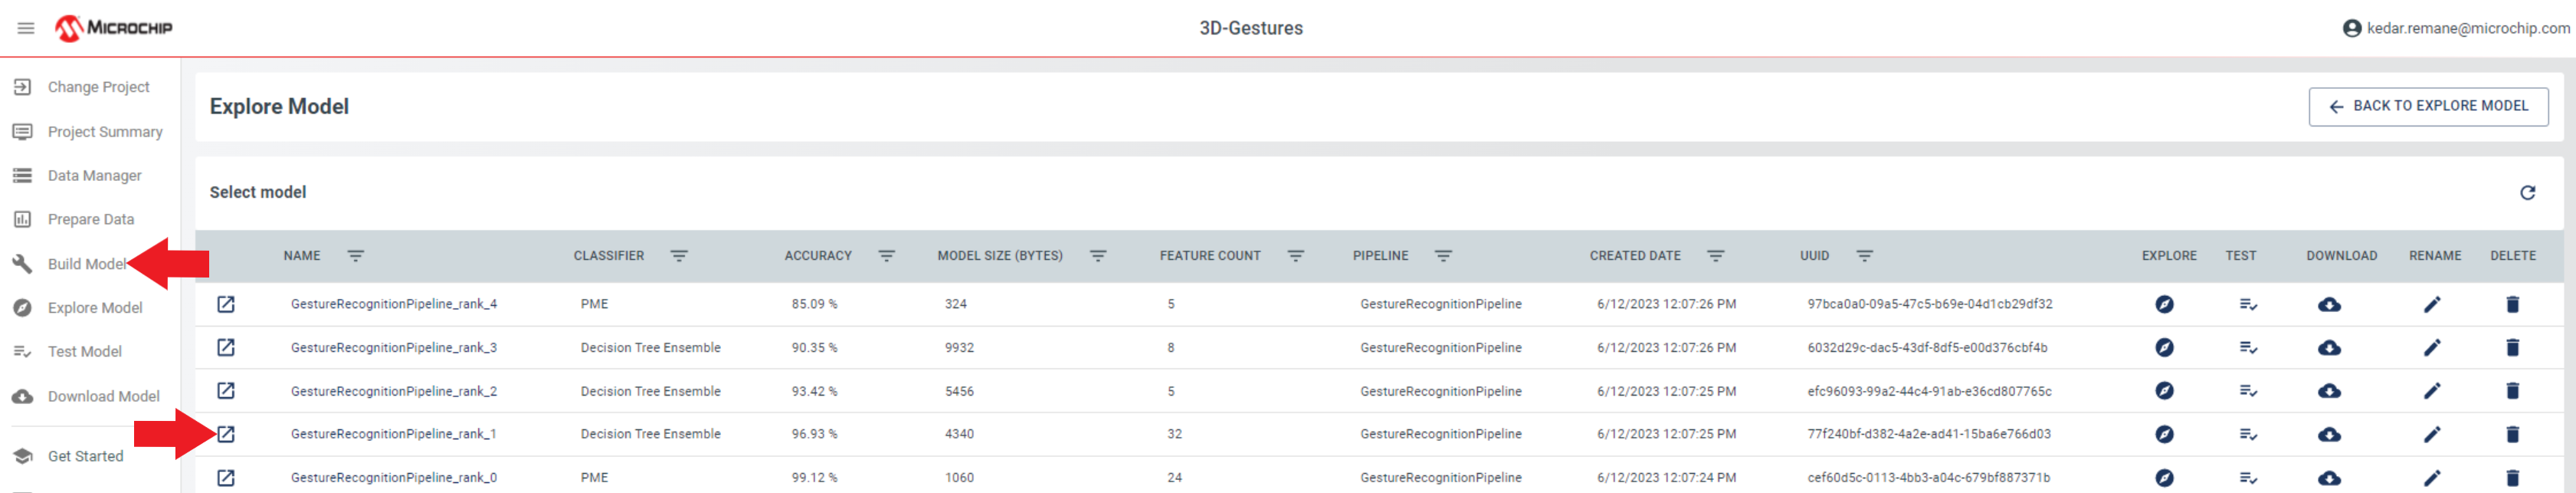
Various output results can be viewed by accessing each of these options.
After completion of the Build Model optimization step, navigate to the Test Model tab.
To filter the data and select only the test samples and to compute accuracy and generate a confusion matrix for them:
Select the Session to work with.
Locate the upside-down triangle icon in the Fold column, then click it.
From the drop-down menu, select “test” to filter the data and display only the test samples.
Locate the ellipsis (…) icon located at the leftmost column of the table, then click it.
From the drop-down menu, select “Select All” to include all test samples in the analysis.
Click the RECOGNIZE button to begin computing accuracy metrics for the selected samples.
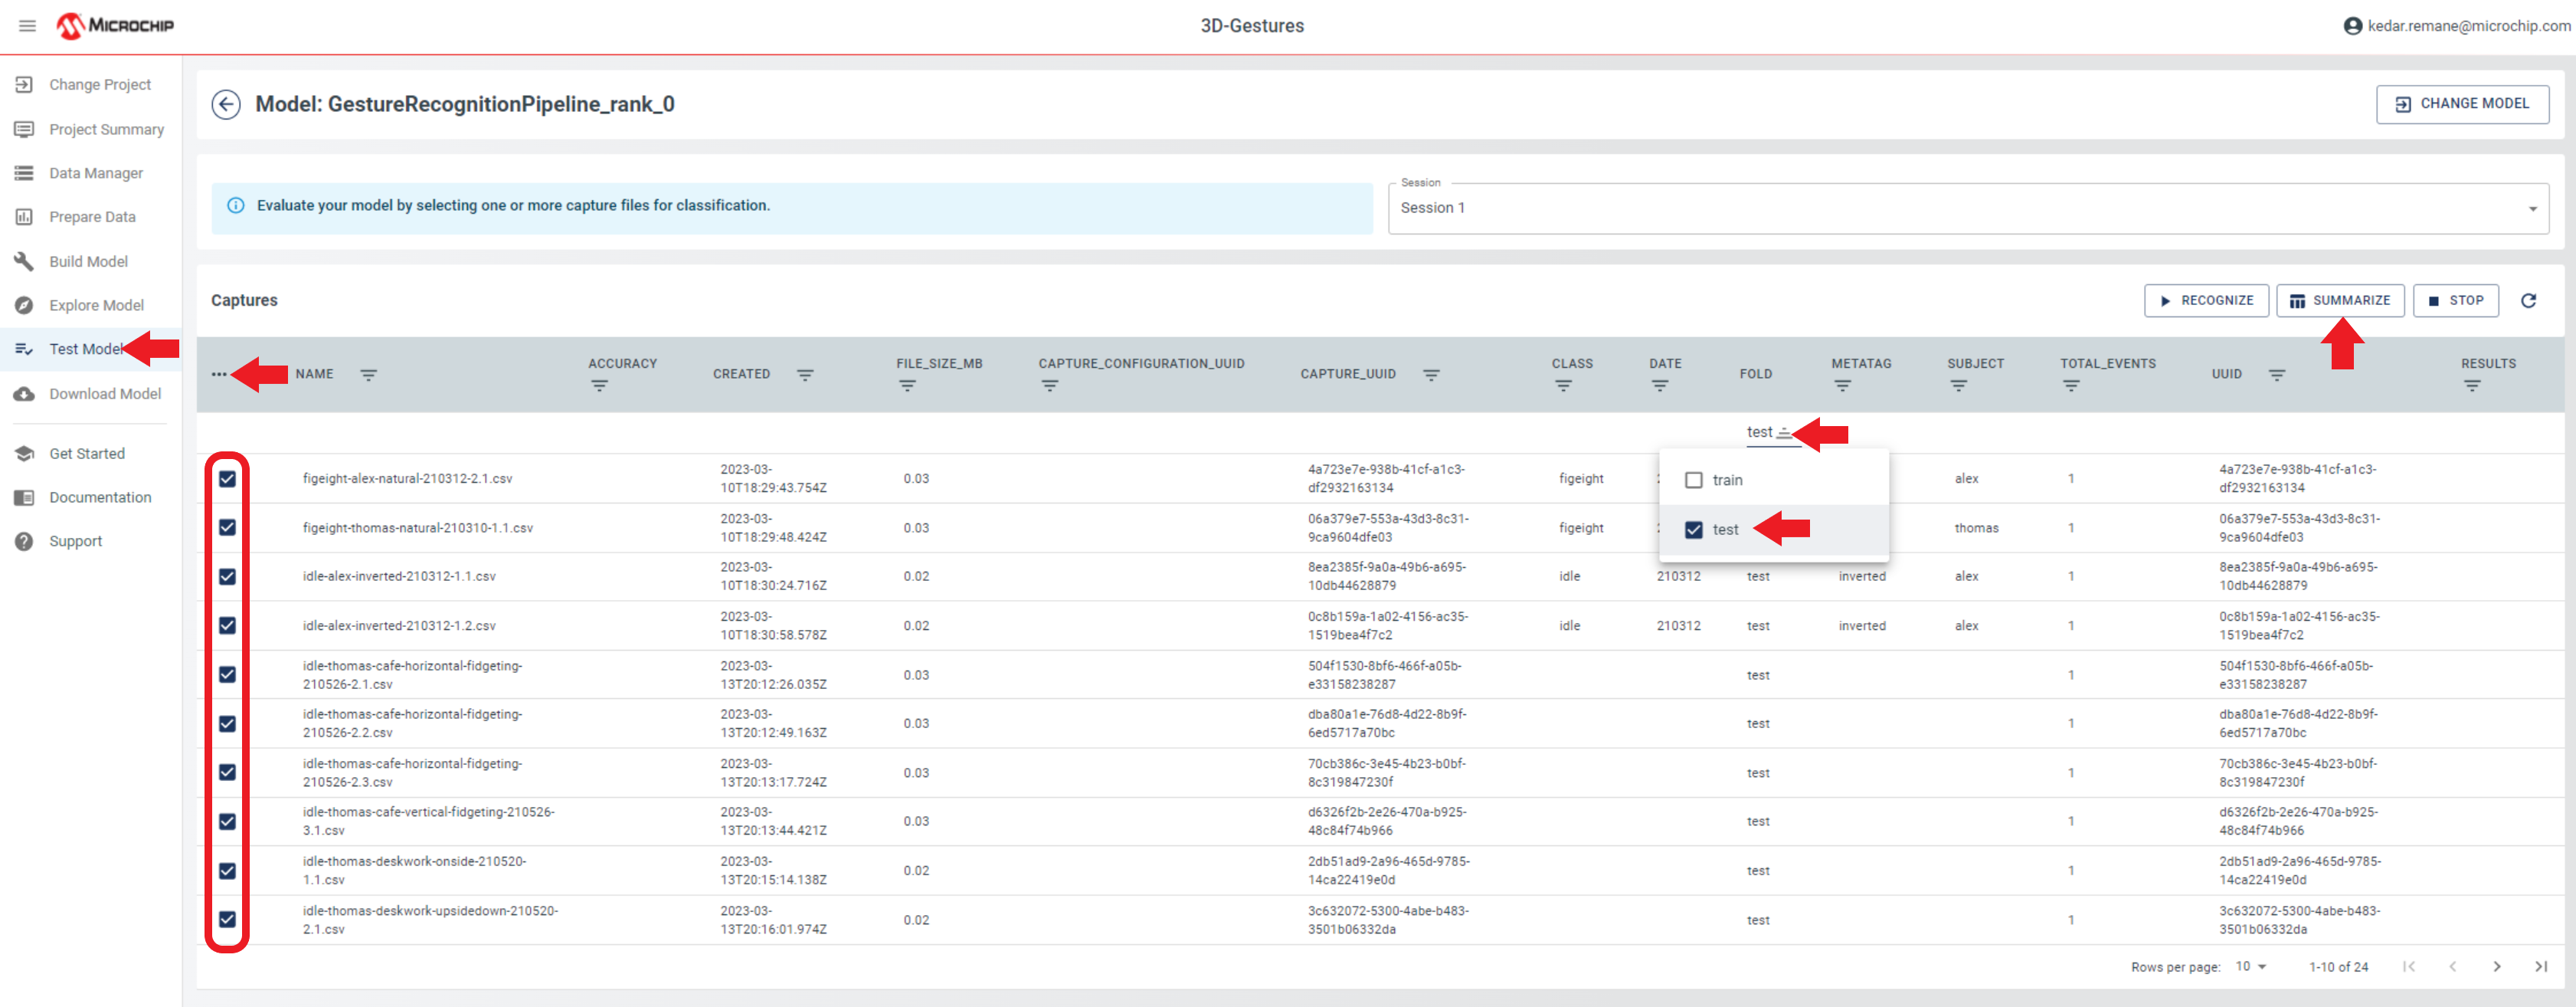
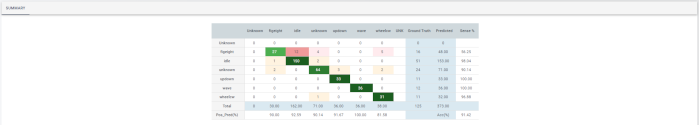
When the accuracy is computed, click the SUMMARIZE button to generate the confusion matrix for the test samples.
Note that this process may take a few minutes to complete. When finished, a table summarizing the classification results will be generated.
To deploy the model, navigate to the Download Model tab. Select the appropriate compiler based on the hardware used.
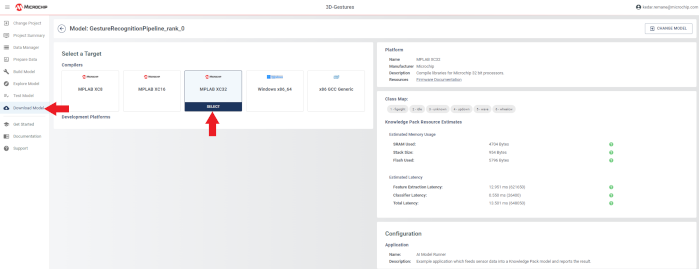
Fill out the Knowledge Pack settings using the Pipeline, Model and Data Source you created previously.
Select the library output format.
Click the DOWNLOAD button.
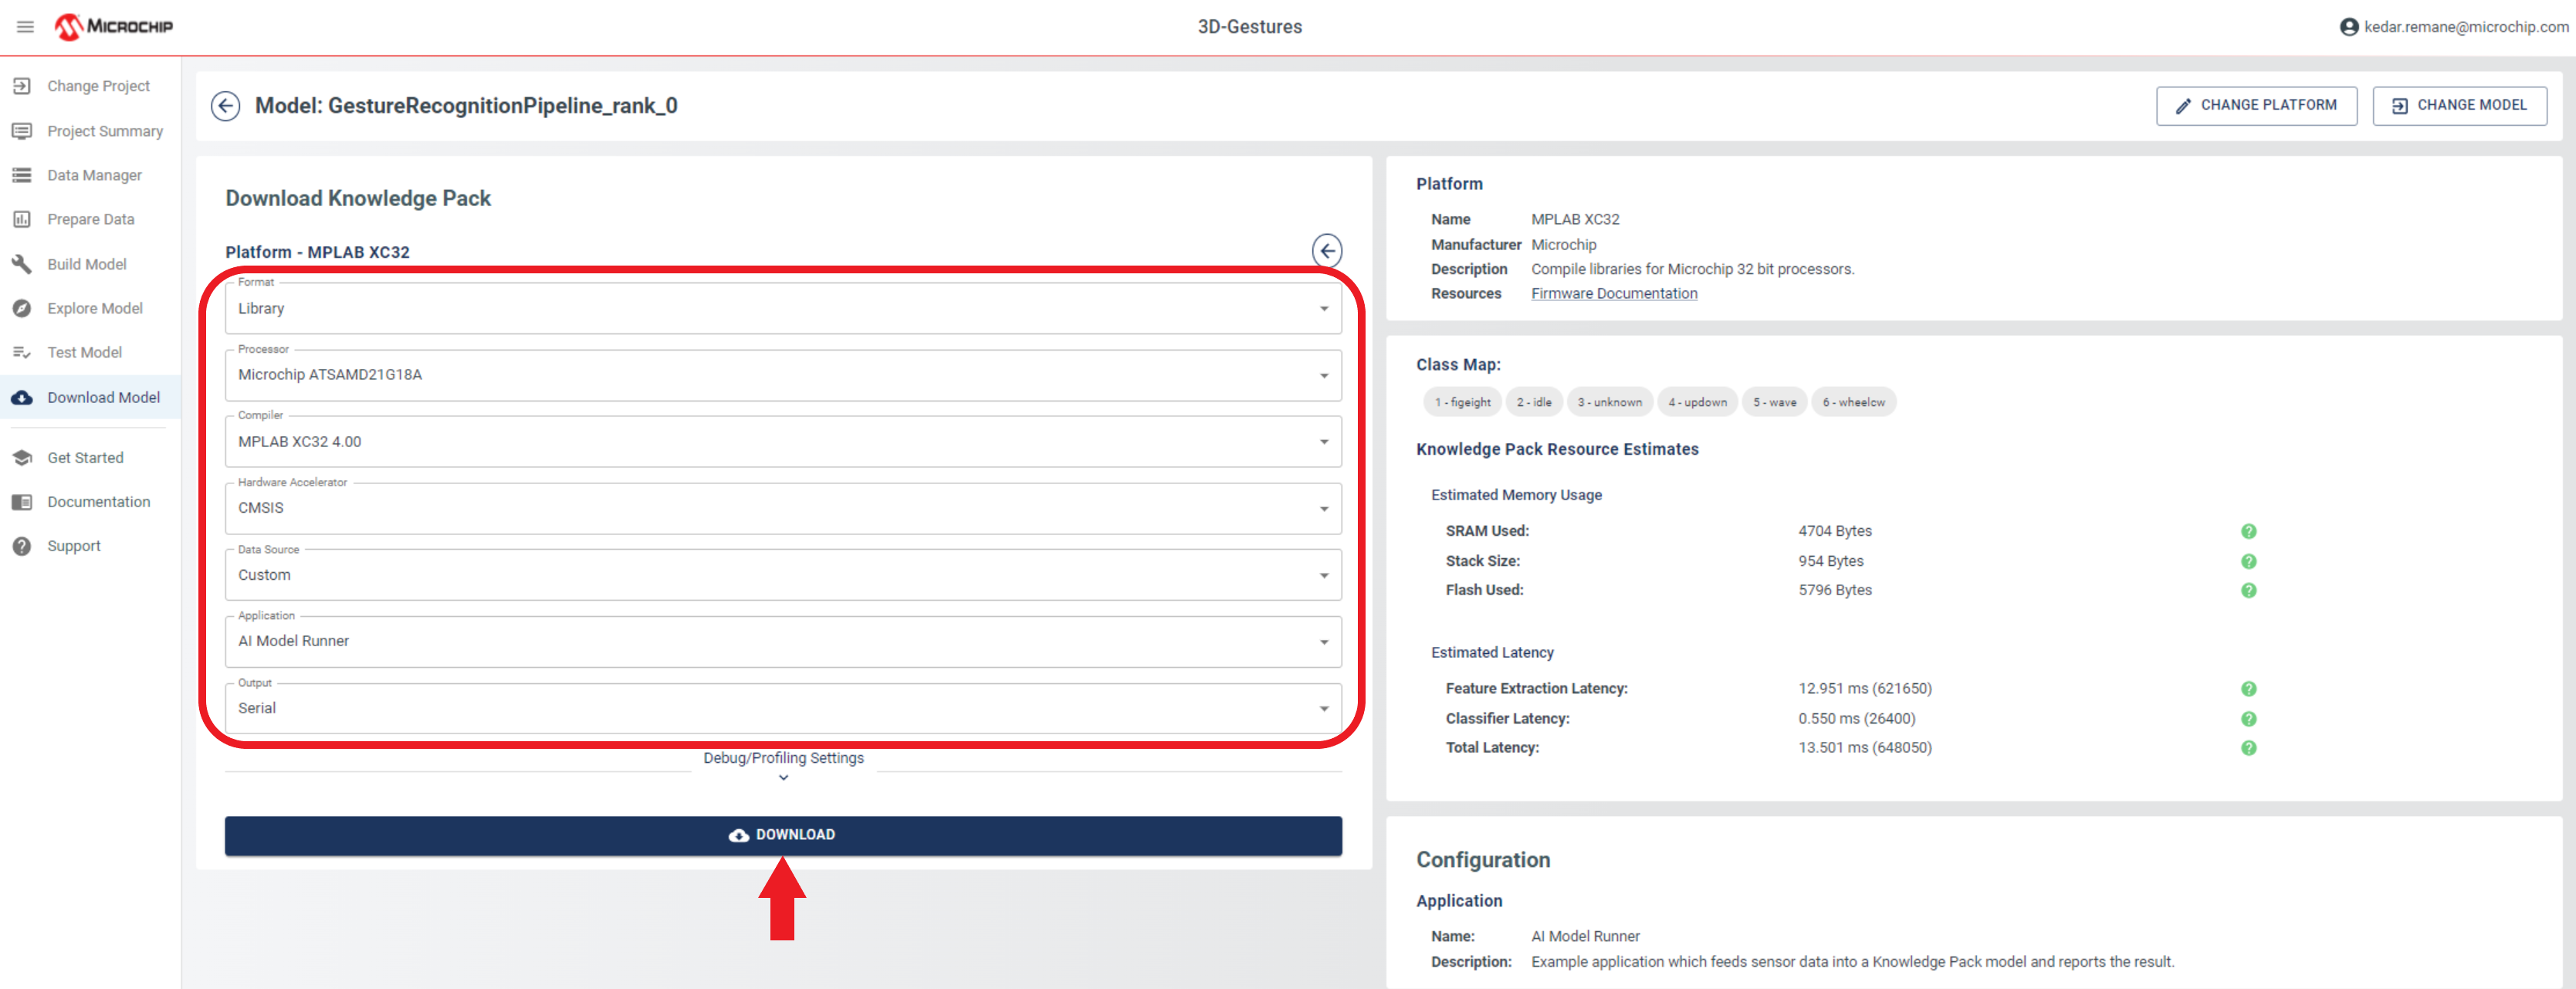
By completing these steps, you will be able to deploy your model and make it available for use. It is important to ensure that all the necessary settings are correct, before proceeding with the download.
Knowledge Pack Integration
Integrate the Knowledge Pack APIs into your embedded device firmware by following the Knowledge Pack Integration.