The image below shows the ADCC Basic Printf example running, using the MPLAB Data
Visualizer.
Click the icon
to open the MPLAB Data Visualizer.
Under Debug GPIO, click the icon,
to add to the time plot.
Under the COMx port, associated with
your board, click the icon to set the baud rate to 115200.
Then click the icon
to display text from the COMx port on the terminal.
When using the MPLAB Data Visualizer Time Plot to run the ADCC Basic Printf example, the
following will appear:
9.2 Data Visualizer Setup for MCC Melody Data
Streamer
When using the MCC Melody Data Streamer Library, this section describes the steps needed
to set up the Data Streamer and plot the selected application variables.
Note: These steps will come after configuring the
appropriate components in MCC Melody and clicking to
generate code.
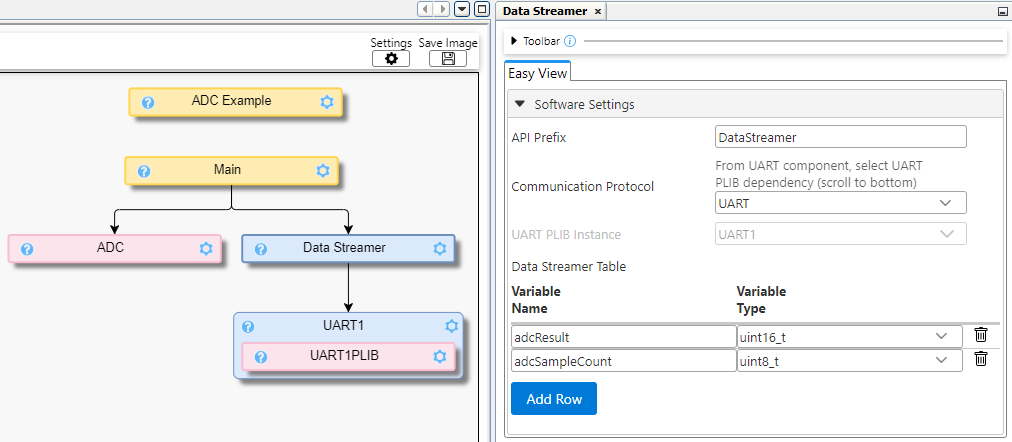
Figure 9-1. An example application using the MCC Melody Data Streamer Library
As part of the MCC Melody configuration, application variables to be plotted must be
added to the Data Streamer Table, giving each a Variable Name and corresponding
Variable Type. Once done, this will look similar to examples 2 and 3 from the
ADC Example Component.
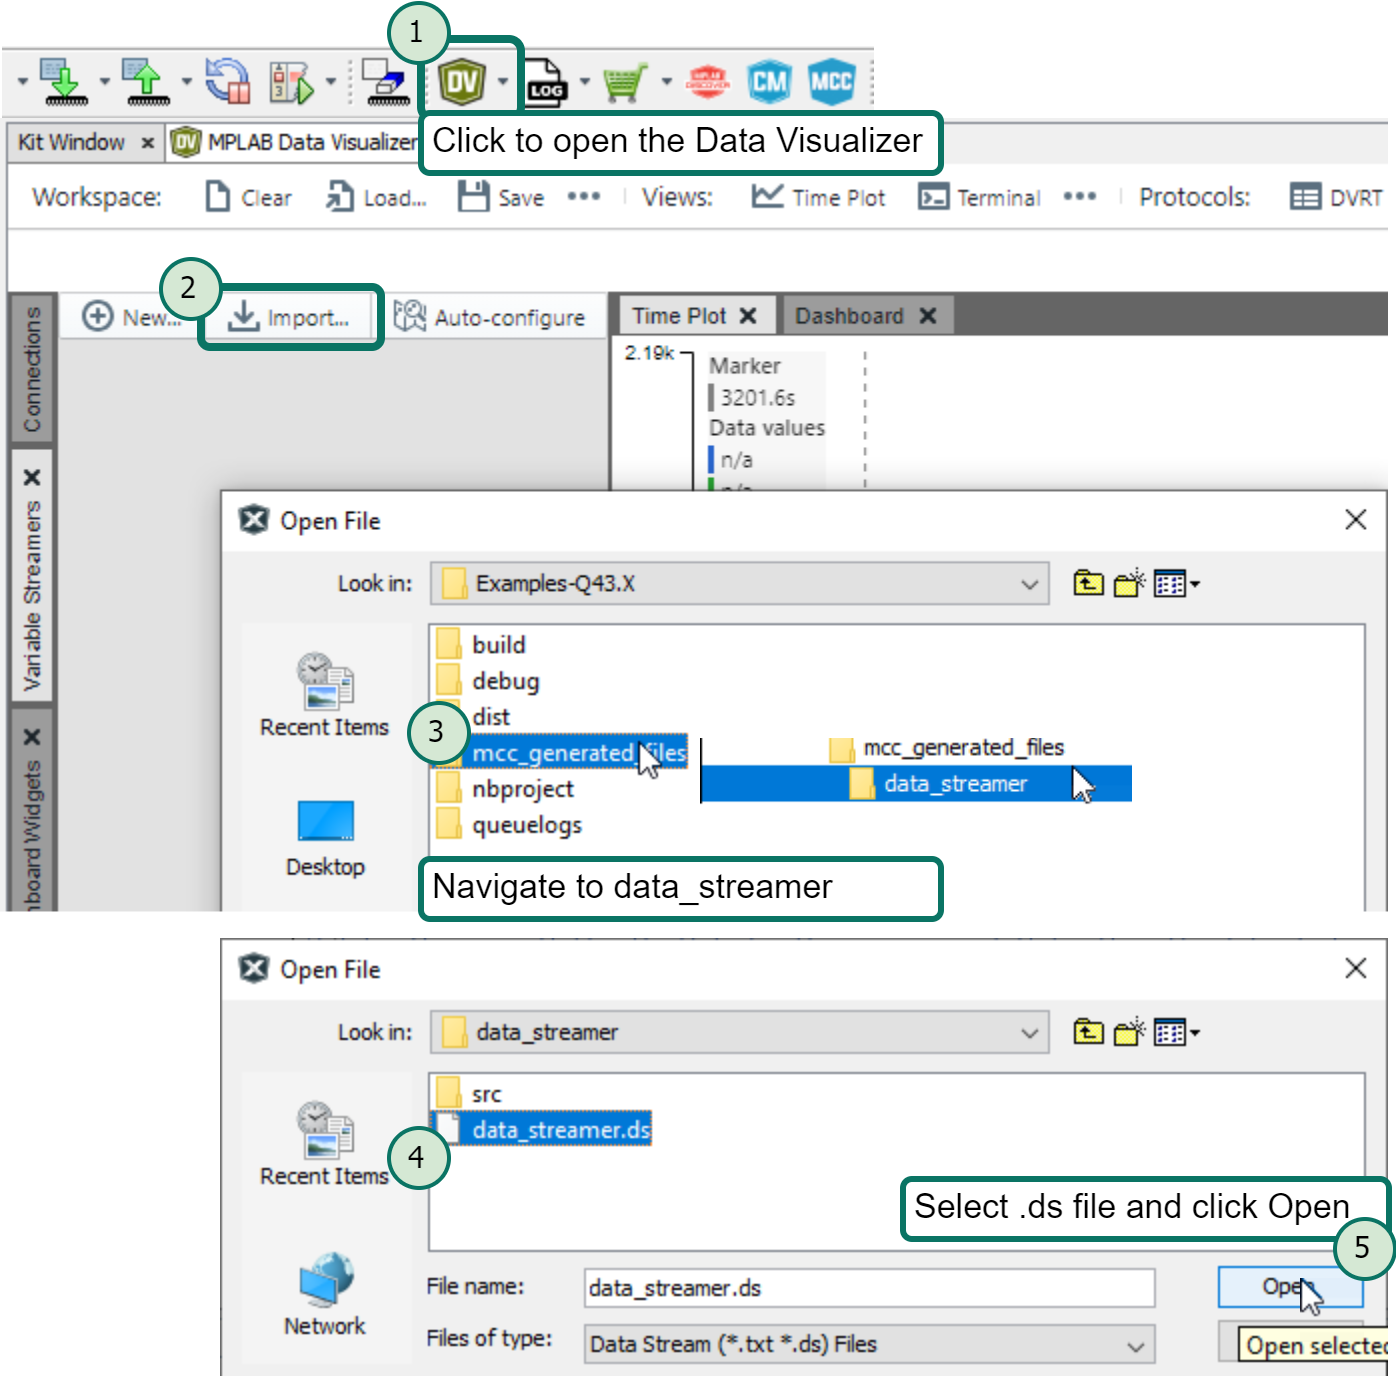
Within MPLAB X click the icon
to open the MPLAB Data Visualizer.
Under the Variable Streamers
tab (on the left-hand side), click the button
to import a .ds file.
From your project root, navigate into
mcc_generated_files/data_streamer/ directory.
Click the data_streamer.ds file to select it.
Then click the button
to load the ds file.
Data Visualizer Configuration
Tip: Load the MCC generated
data_streamer.ds, meaning the Data Streamer variable configuration
file, as follows:
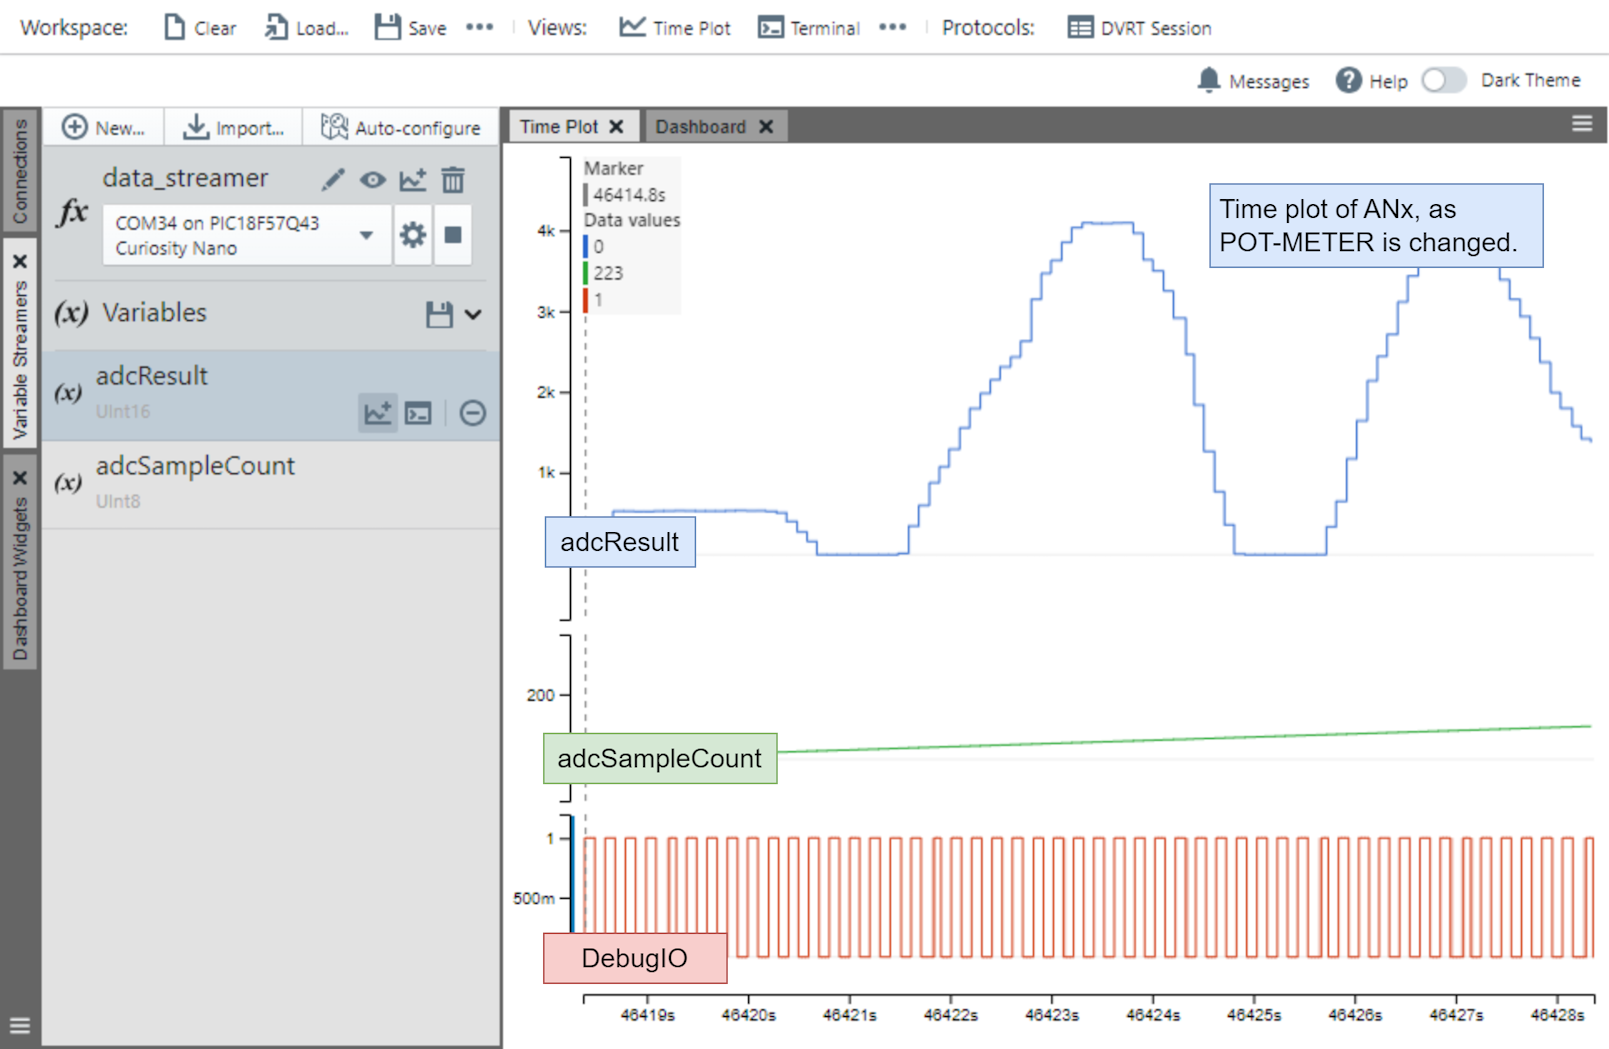
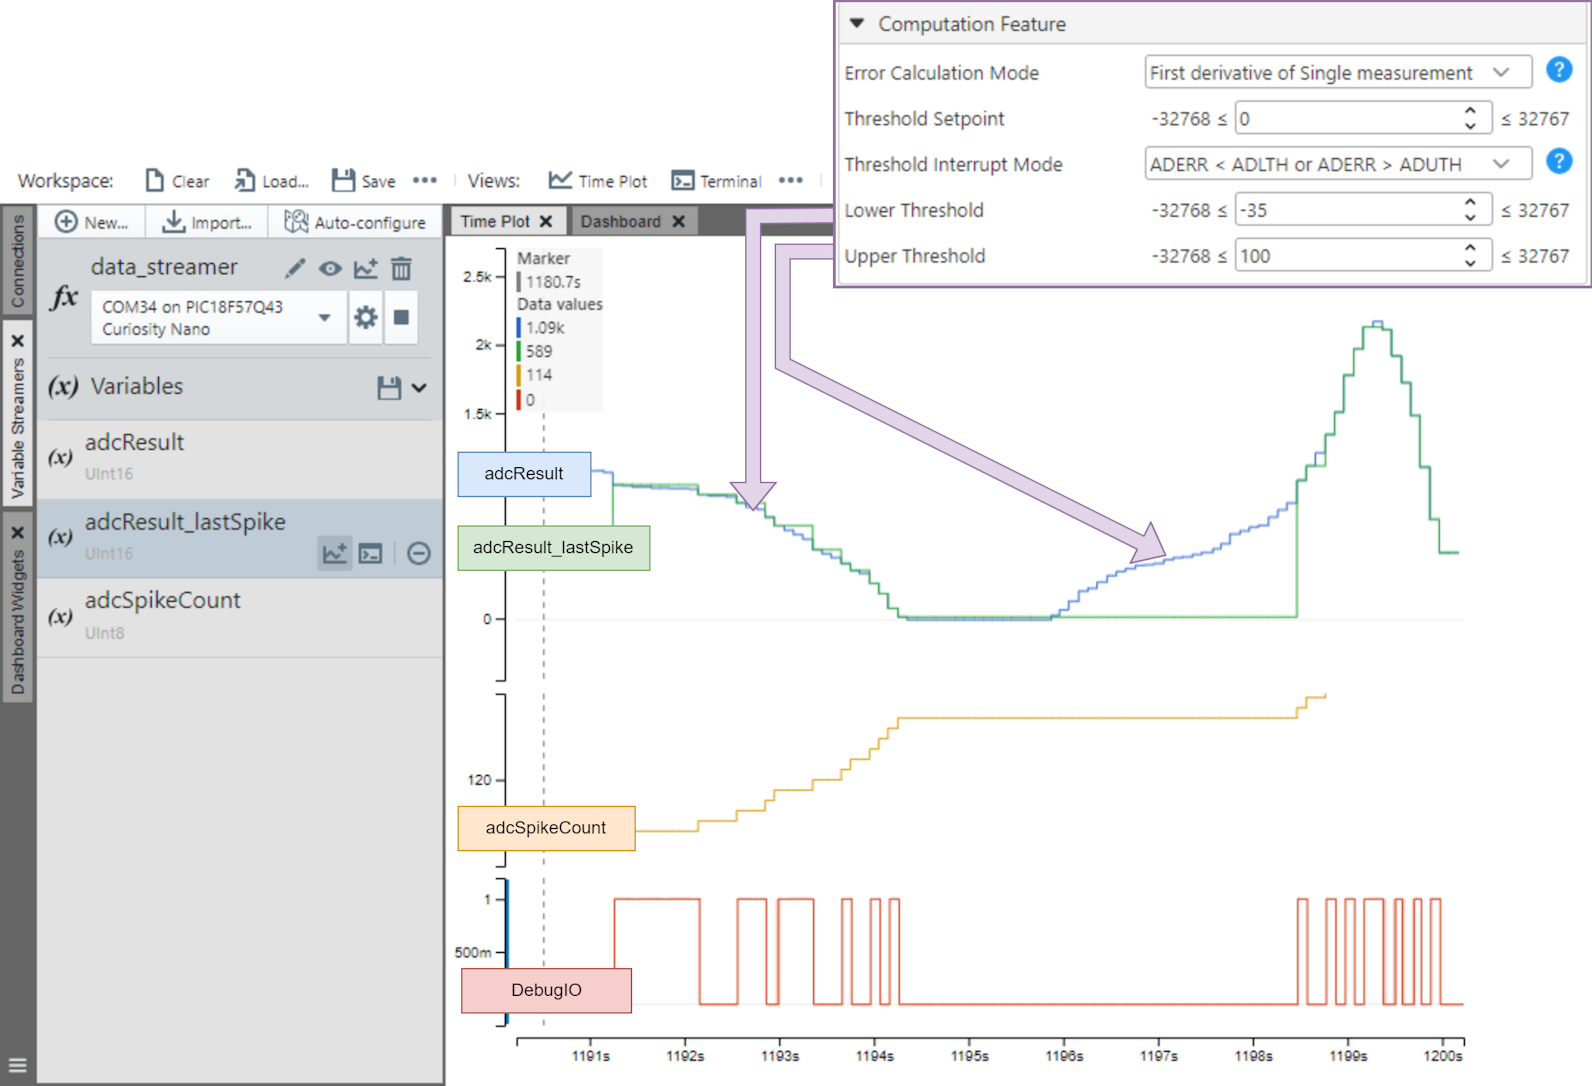
The results when plotting the respective examples are shown below:
Figure 9-2. ADC Data StreamerFigure 9-3. ADC Spike Detect

 icon
to open the MPLAB Data Visualizer.
icon
to open the MPLAB Data Visualizer. icon,
to add to the time plot.
icon,
to add to the time plot. icon to set the baud rate to 115200.
 icon
to display text from the COMx port on the terminal.
icon
to display text from the COMx port on the terminal.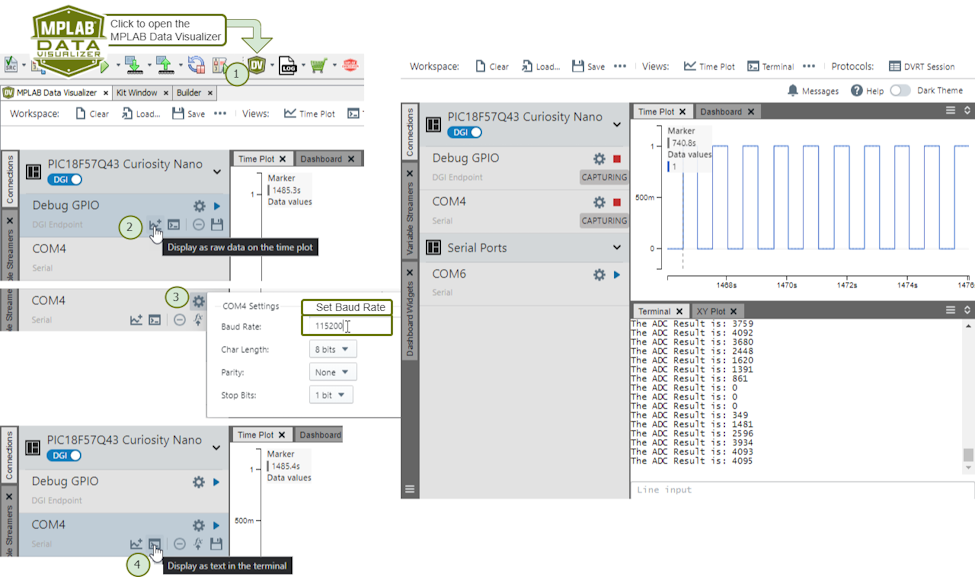
 to
generate code.
to
generate code. 
 button
to import a
button
to import a  button
to load the ds file.
button
to load the ds file.