
7.5 Demo Operation
- Connect the hardware and prepare the demo setup, following the instructions provided in the Demo Setup section
- Configure the Data Visualizer, following the instructions provided in the Data Visualizer Configuration section
- Click the Serial Port Connect button
- Click the SW0 button on the Curiosity Nano board and select the appropriate frequency for the three-phase signal. The selected frequency is displayed on the custom dashboard window.
- Zoom in or out the graph located in the Graph window by clicking the +/- magnifier symbol on the right hand top side
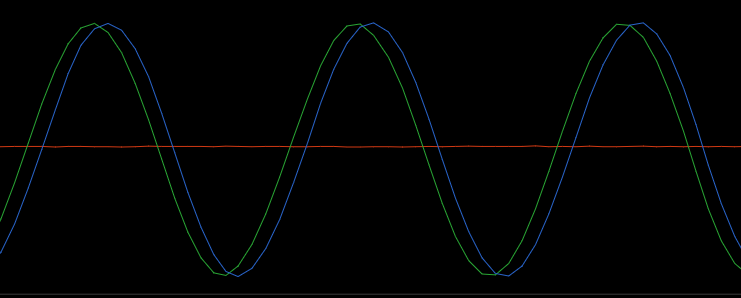
Insert a phase-loss fault by clicking the L1 radio button on the dashboard, which disables the L1 signal out of the three-phase signal to emulate phase-loss input. Figure 7-13 (below) shows the three-phase signal with L1 phase-loss fault and the L1 phase-loss status indicator on the dashboard.
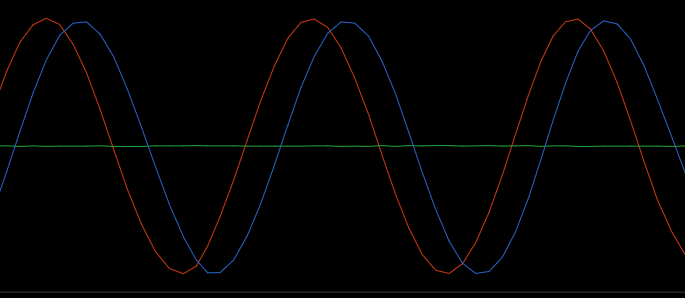
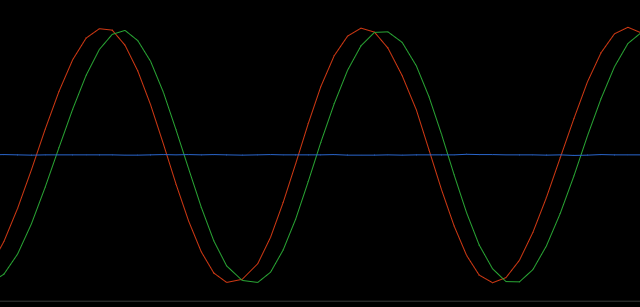
Phase-loss faults on L2 and L3 can be similarly inserted by clicking the L2 or L3 radio button on the dashboard, which disables the corresponding signal to emulate phase-loss input. Figure 7-14 and Figure 7-15 (below) show the three-phase signal with the corresponding phase-loss faults; the corresponding phase-loss status indicator appears on the dashboard.
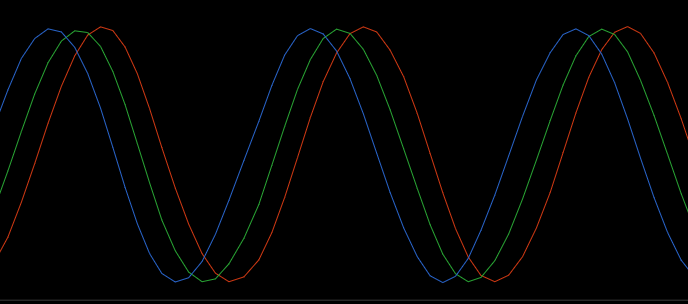
- Insert a phase-reversal by clicking the PR radio button on the dashboard, which changes the sequence of the three-phase signal to L1-L3-L2. Figure 7-16 (below) shows the phase-reversal input and phase-reversal status indication on the dashboard.
Refer to the User Inputs section for more information.