The first step is to plug the hardware device to the power line. Then,
connect the USB cable to the host computer. And, start the PLC PHY Tester software
using, for example, the link created on the desktop during the install process. In order
to work with PLC PHY Tester, the hardware must be flashed with the PHY Tester tool
embedded application.
The PLC PHY Tester has been designed to work as a wizard commonly used
by many desktop applications. The wizard is structured in tabs that are shown and
enabled as the user sets configurations specific for each tab, and goes to the next tab
by means of the proper button.
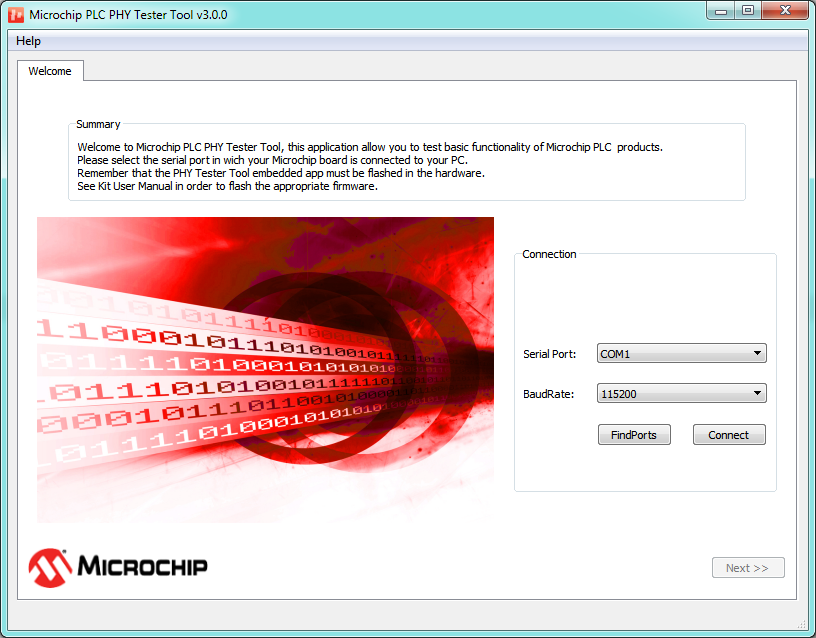
Welcome Tab
The main window that appears as soon as the application is
started shows a welcome message and asks the user to select the serial port
where Microchip PLC Development Board has been connected.
Figure 1-39. Starting Window
The user must select the proper port and baudrate to connect and
then press the Connect button. As soon as the button is pressed the
button text changes to Connecting triggering a process of board
identification; after few seconds the button text changes to Disconnect
which means that the identification process has finished. A new tab, Product
Information, appears on the wizard and the Next button is enabled
allowing the user to advance to the following step of the configuration. In case
of error, check the FW of the board and configuration of the serial
connection.
Product Information Tab
As soon as the user presses the Next button in the
Welcome tab, a new tab is shown:
Figure 1-40. Product Information Tab
The Product Information tab shows basic board information and asks the
user to configure the board as transmitter or receiver.
The information shown is related to the physical layer
implemented in the firmware of the board:
Product ID: Shows
a text string identifying the Microchip PLC product (platform)
Model ID: Is a
16-bits unsigned integer that identifies the model of the board
Firmware ID: Is a
32-bits unsigned integer that identifies the physical layer firmware
version running on the board
The next tab depends on transmission or reception test
selection. For reception tests, Reception Parameters and Rx Test
Parameters tabs are added. For transmission tests, Transmission
Parameters and Tx Test Parameters tabs are added. Finally,
independently of the kind of test selected, two more tabs are added:
Configuration Summary and Test Execution. All of these tabs
are disabled at this point; as the user navigates through the wizard with the
Next and Prev buttons, the tabs become enabled.
Reception Parameters for PRIME PHY Layer Figure 1-41. Reception Parameters Tab for PRIME PHY Layer
This tab allows the user to configure all parameters related with the reception
of frames. Configurable parameters are as follows:
The “Channel” option
configures the physical channel where the PRIME Network is running
The “Perform EVM test”
option changes message and interval of reception in order to make a test
that evaluates the PHY layer performance. In Test Execution tab,
some extra columns are added in order to obtain additional information
about performance of the PHY layer.
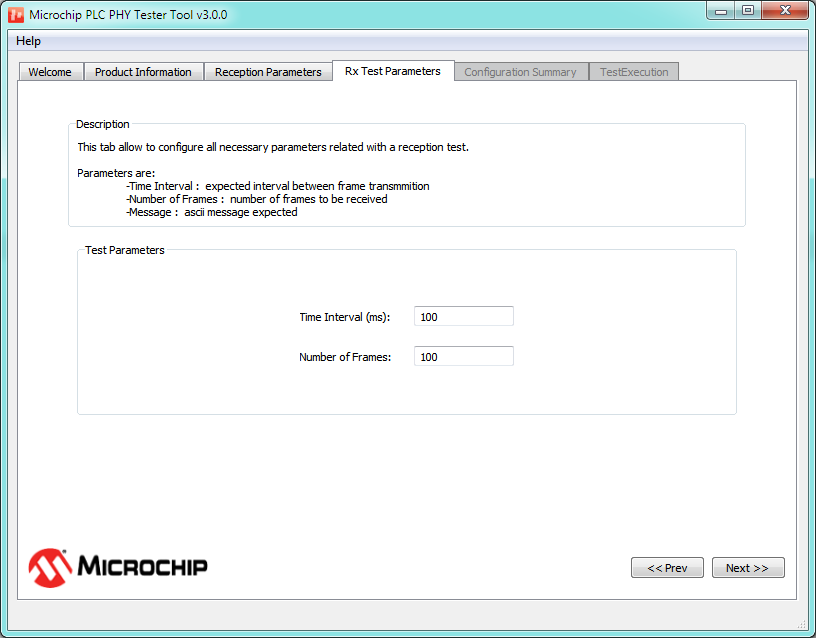
Rx Test Parameters Tab
This tab allows configuration of the reception test parameters.
These parameters are the amount of expected messages to be received and the time
interval from message to message (receiver instance will wait for this time
prior to consider message is missed). These parameters are used just for test
statistic results. Unlike the previous one, this tab is common for all the
Microchip PLC protocols. The following figure shows the tab layout:
Figure 1-42. Rx Test Parameters Tab
Transmission Parameters for PRIME PHY Layer
Figure 1-43. Transmission Parameters Tab for PRIME PHY Layer
This tab allows the user to configure all parameters related with the
transmission of G3-PLC PHY frames. Configurable parameters are the following:
Channel: Configures the
channel where the PRIME Network is running
Frame type: Allows
selection between Type A, Type B or Type BC
Modulation scheme:
Modulation selection
Attenuation level:
Configures the transmission power injected to the PRIME Network
Transmission mode:
Configures the output stage depending on the line impedance seen by the
board
Perform EVM test:
Selecting this option changes the message and interval of transmission
in order to make a test that evaluates the PHY layer performance
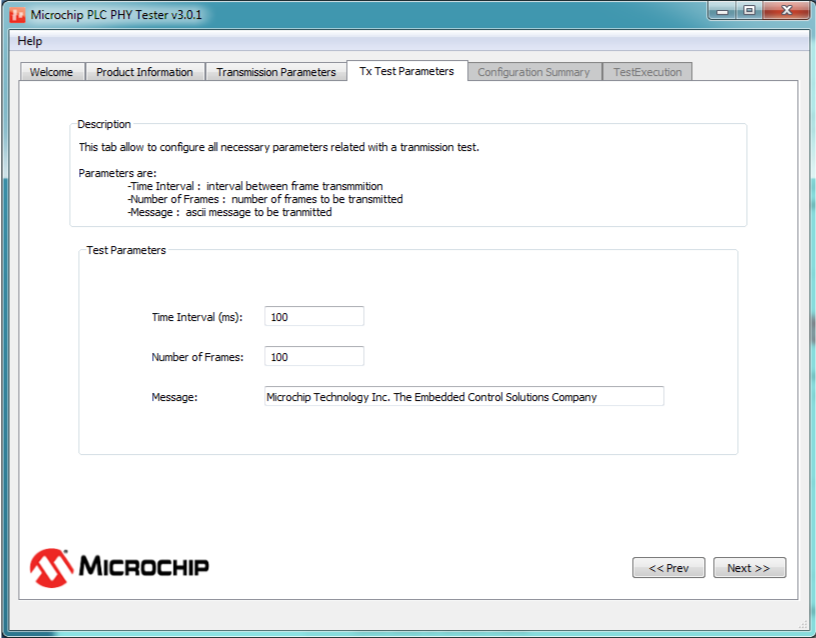
Tx Test Parameters Tab
This tab is very similar to the Rx Test Parameters tab.
The “Message” parameter allows configuration of the content of the message to be
transmitted in ASCII characters. the “Time Interval” parameter defines the
interval of time, measured in milliseconds, between the transmissions of two
messages (This time interval indicates the time between the beginnings of two
frames). Finally, the “Number of Frames” parameter allows configuration of the
number of messages to be transmitted. As in the Rx Test Parameter tab,
this tab is independent of PHY layer.
Important: 10ms drifts in the transmission and
reception times may appear due to the application running on a non-real time
operating system.
Important: A "Time Interval" shorter than 70
milliseconds may not work properly due to PC OS and USB connection. Use the PHY
TX console firmware example to transmit messages with shorter time
interval.
Figure 1-44. Tx Test Parameters Tab
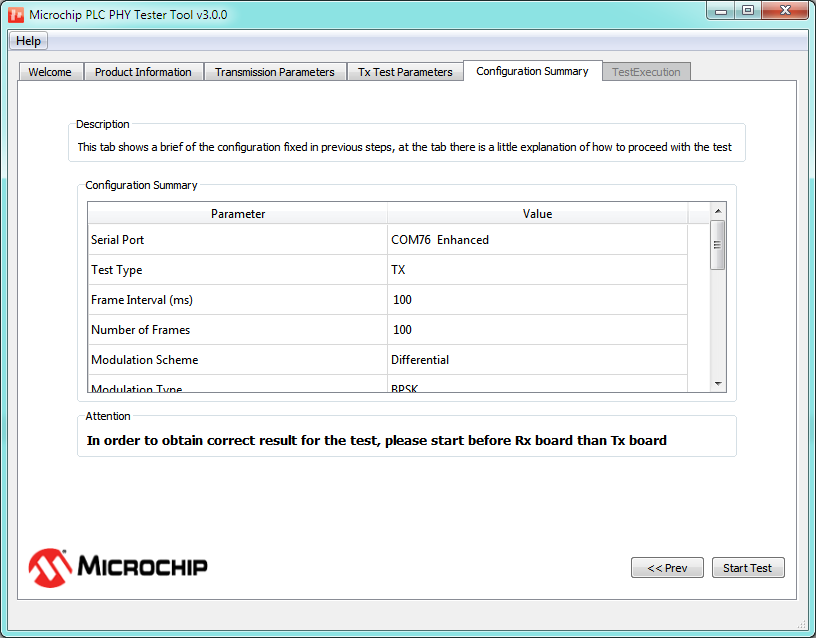
Configuration Summary Tab
This is the last tab in the wizard before starting the execution
of the test. This tab shows a table where all the configuration parameters are
listed that have been configured along the wizard. The Next button has
been substituted with a Start Test button that allows starting the
message transmission or reception.
Figure 1-45. Configuration Summary Tab of a Transmission Test
Test Execution Tab
This is the tab shown while the test is being executed; it shows
the transmission or reception of each message in form of a table. The following
figures show examples of this tab for transmission and a reception tests:
Both views (Tx and Rx) show tables representing different
information depending on test type (transmission/reception). When the test is
finished or is cancelled, a final report is shown at the bottom of the tab.
This tab will provide additional information about signal
quality in case of selecting "Performing EVM Test" check-box in the Reception
Parameters tab.
The user can copy the information included in the corresponding
table to the clipboard by clicking on the Copy Table button. This tab is
only able to hold the information of the last 10000 frames; the user can choose
a bigger number of frames to be transmitted/received. However, only the last
10000 frames will be available.
Reception Test Results
Figure 1-46. Execution Tab for PRIME PHY Layer Rx Test
Information included in the table is as follows:
Frame #: Indicates the
received frame number
Frame type: Indicates the
frame type: Type A, Type B and Type BC
Modulation scheme:
Indicates if modulation scheme
SNR (dB): Signal-to-Noise ratio calculated as PRIME 1.4 Spec
EVM (dB): Error Vector Magnitude calculated as PRIME 1.4 Spec
RSSI (dBuV): Indicates
the strength of the received signal in dBuV
Data: Is the received
info in ASCII format
Rx interval: Is the
interval of time between the reception of the current frame and the
previous one
Payload integrity: Shows
if the content of the frame is correct or not
After all frames have been received, or the test has been
cancelled, a text box with information about the test will be shown at the
bottom of the tab. First of all, test timestamps are shown; this information is
measured by the PC application. After that, there is a section called Frame
Error information that shows information about received frames and possible
errors. Fields shown in this section are:
Total Frames Received:
Shows the number of frames detected, not taking into account if the
frame has errors
Total Frames Bad Header
CRC: Shows the number of frames in which the header CRC8 is not valid.
These frames are discarded by the firmware and are not reported in the
application
Total Frames Bad Header
LEN: Shows the number of frames in which the header LEN is not correct.
These frames are discarded by the hardware and are not reported in the
application
Total Frames Bad Payload:
Shows the number of frames where the content of the payload is not what
it is supposed to be
Total Frames Received OK:
Shows the number of frames received with the correct content
Transmission Test Results
Figure 1-47. Execution Tab for PRIME PHY Layer in Tx Test
There are eight columns that show the following information:
Frame #: Indicates the
number of frames transmitted. It is useful to track the test
progress
Tx result: Indicates the
result of the transmission. If an error occurs, a descriptive text will
appear
RMS_Calc: This number is
related with the impedance detected in the power line; it is used by the
PHY layer to determine the Transmission mode
Data: Shows the message
received in ASCII format
Tx interval: Represents
the time interval between the current frame and the previous one
After all frames have been transmitted, a text box with
information about the test will appear at the bottom of the tab.
Test timestamps are provided; this information is measured by the PC application.
After that, there is a section of information called Frame Error information
that shows information about transmitted frames and possible errors. Finally,
another section shows a summary of the transmission test; apart from known
transmission parameters other parameters are shown:
Frame Symbols: Is the duration in symbols of the frame
Frame Duration: Is the
duration in millisecond of the frame
Tx Mean Interval: Is the
average interval between transmissions calculated from top table
data
Effective Baudrate
(Peak): Is the effective baudrate if frames were transmitted
consecutively, calculated as following:
Effective Baudrate
(Real): Is the effective baudrate, calculated as following:
Raw Baudrate (Peak): Is
the baudrate taking into account all headers that previous baudrates
have not considered if frames were transmitted consecutively, calculated
as following:
Raw Baudrate (Real): Is
the baudrate taking into account all headers that previous baudrates
have not considered, calculated as following:
Channel Usage : Is the
percentage of channel that has been used, calculated as following:


 This tab allows the user to configure all parameters related with the reception of frames. Configurable parameters are as follows: