The Smith Chart helps in visualizing the complex impedance. The complex impedance becomes a real point in a chart for a defined frequency. A trace in the chart represents the complex impedance over the frequency for a wider frequency range. The following figure shows an example Smith Chart frequency sweep.
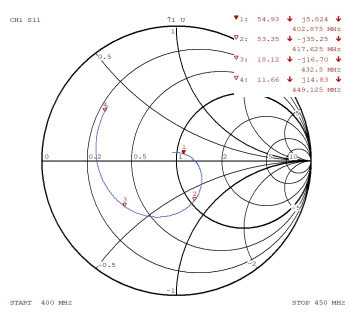
The frequency sweep is done from 400 MHz to 450 MHz. The marker table displays the impedance for four preselected frequencies. Marker 1 is very close to the target impedance of 50Ω, whereas the impedance at marker 4 is not suitable for a 50Ω system. Bandwidth and performance over the matching frequency can be obtained from the S-parameter as shown in Figure 1. This chart gives an impression of the energy transfer into the network with the selected matching. For an ideal condition, all markers would be at 50Ω, but the situation is more complex due to the frequency dependency as given in Figure 1 and Figure 2.