
6 Appendix A: Plotting Graph in Data Visualizer
In the example source code, the ADC result value is sent through EUSART to the serial terminal of the Data Visualizer and this serial terminal data is fed as input to plot the graph.
The data streamer protocol is used to send the ADC result to the serial terminal.
How to use data streamer protocol to send 16-bit value:
The ADC has been configured for 10 bits and this 10-bit ADC result needs to be sent to an 8-bit EUSART. As one ADC result value will be sent as two bytes, a data streamer protocol has been used to send the ADC result to a serial terminal as below, so that one 16-bit value will be used to plot the graph.
EUSART_write(0x03);  //START
EUSART_write(adc_data_LSB);
EUSART_write(adc_data_MSB);
EUSART_write(0xFC); //END
Data Visualizer Configuration:
- Open Data Visualizer
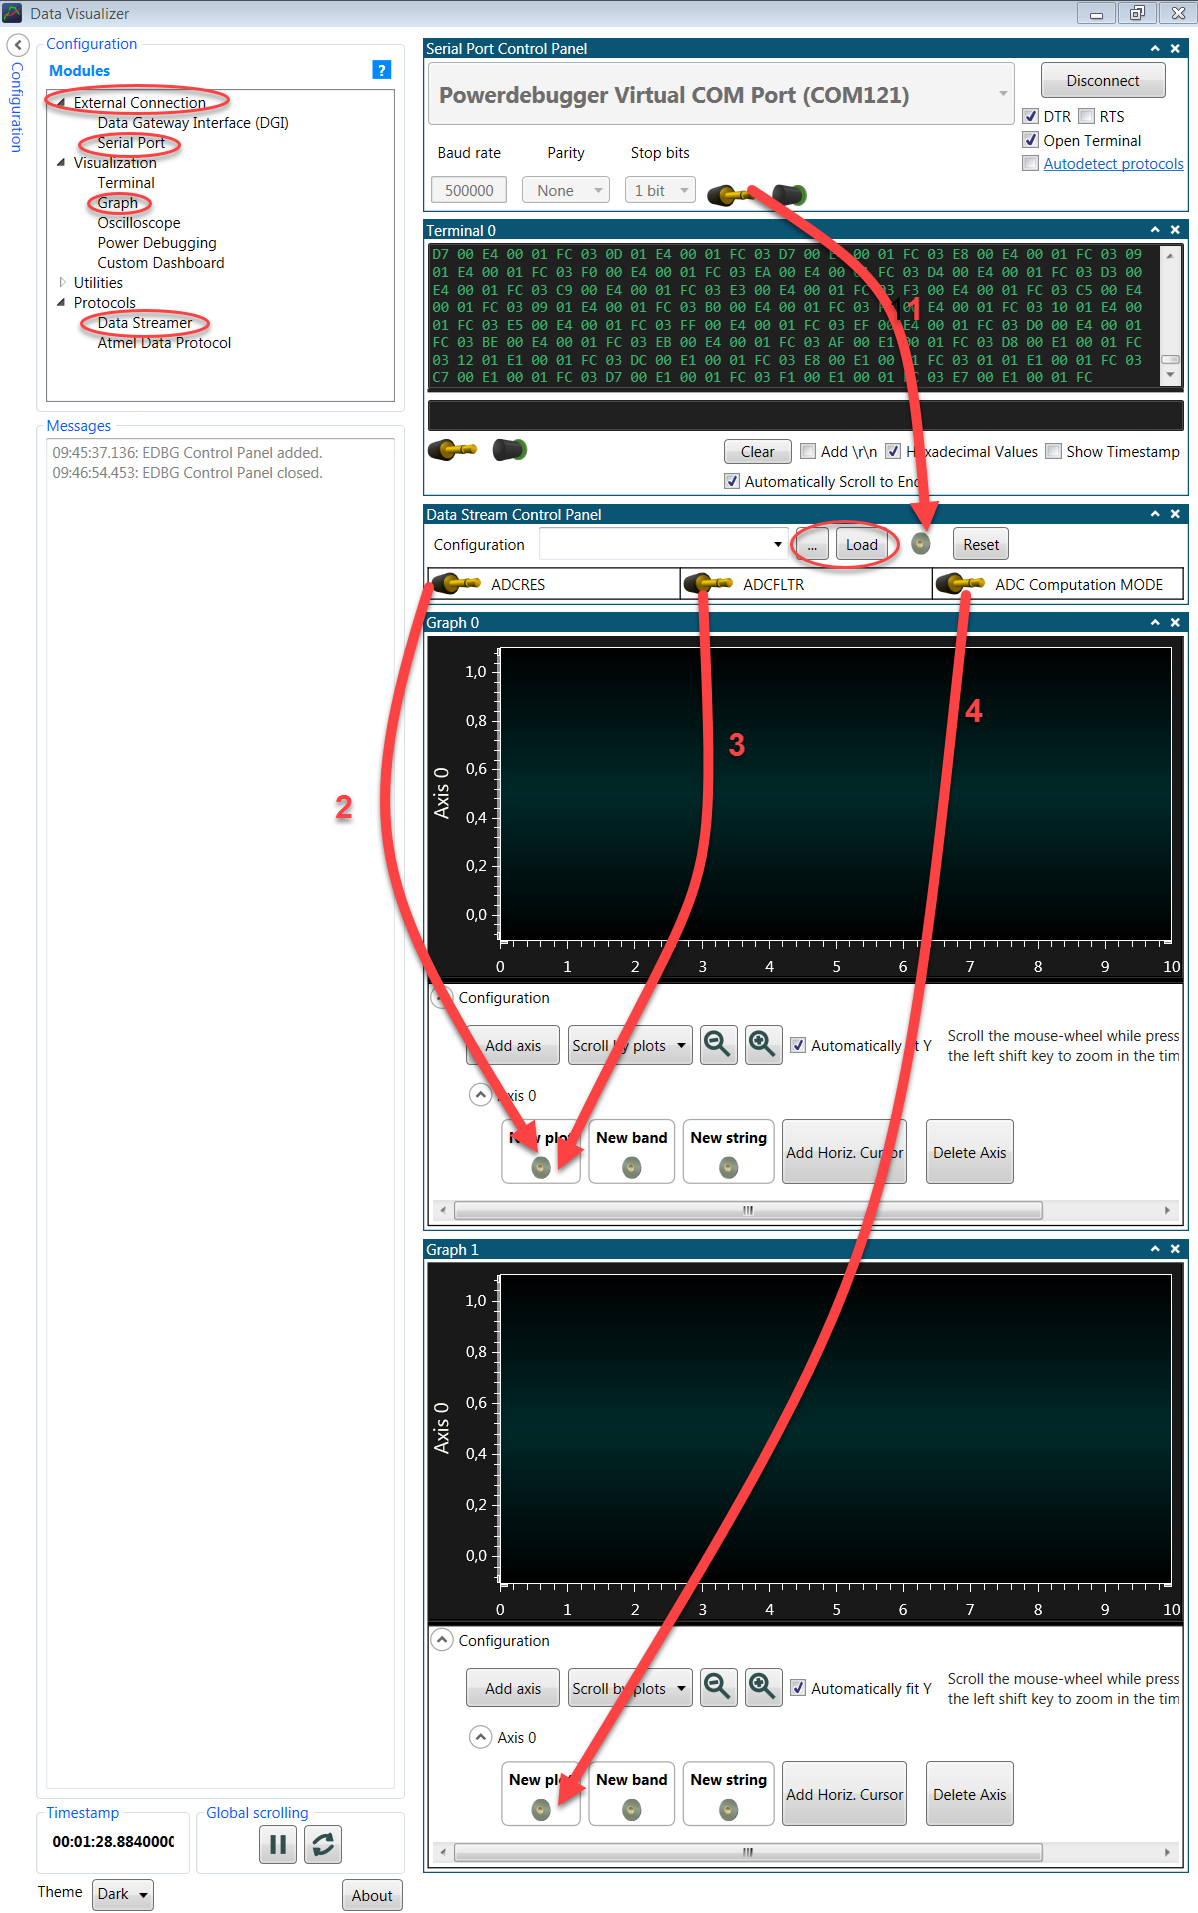
- Open Configuration → External Connection → Serial Port, in Data Visualizer
- Select the EDBG Virtual COM port, Baud rate: 500000 and then select Connect
- Open Configuration → Protocols → Data Streamer
- In Data Stream Control
Panel, under Configuration, browse to the
configuration file and then select LoadNote: In this case, the configuration file is
noise_suppression_data_streamer.txtand can be found in the example source code project folder.Note: For more details on Data Streamer, refer to Data Visualizer User's Guide. - Open Configuration
→ Visualization → GraphNote: Open two windows of Graph, one for 'ADC results' and one for 'ADC Computation mode number'.
- Drag the connections as shown with red arrows in Figure 6-1 to plot the graph
To adjust the Y-axis in the graph, follow the points below:
- Under Configuration in Graph, deselect Automatically Fit Y
- Click somewhere inside the plot area
- Scroll the mouse-wheel while pressing or holding the Ctrl key
To adjust the X-axis in the graph, follow the points below:
- Click somewhere inside the plot area
- Scroll the mouse-wheel while pressing or holding the Shift key