4 TIE Jitter
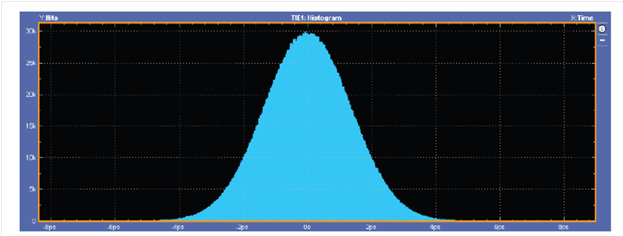
Measuring TIE jitter is very difficult with only an oscilloscope. Typically, a histogram is necessary to plot the measurement values against the frequency of occurrence of the measurements. An example of a jitter histogram for a TIE measurement is shown below. In this case, the continuous variable is mapped into 500 bins and the total population of the data set is 3,200,000.
The mean value of TIE is theoretically zero and, as can be seen in this measurement, the mean value is 0ns. For this plot, the distribution is approximately Gaussian with a standard deviation of 1.3ps.