
5.1 Feedback Ripple vs. Transient Response for Transient Step 2.5 to 5A (Slew Rate = 2.5A/3 us)
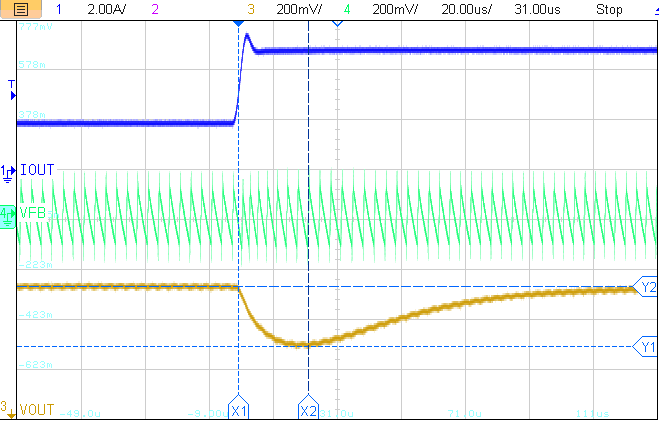
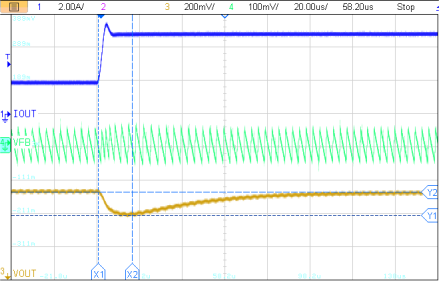
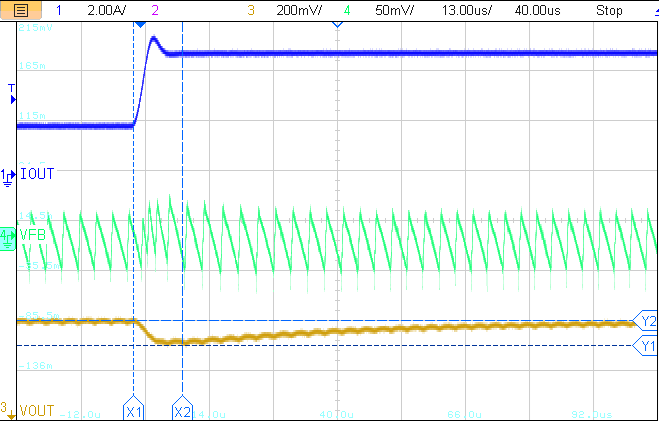
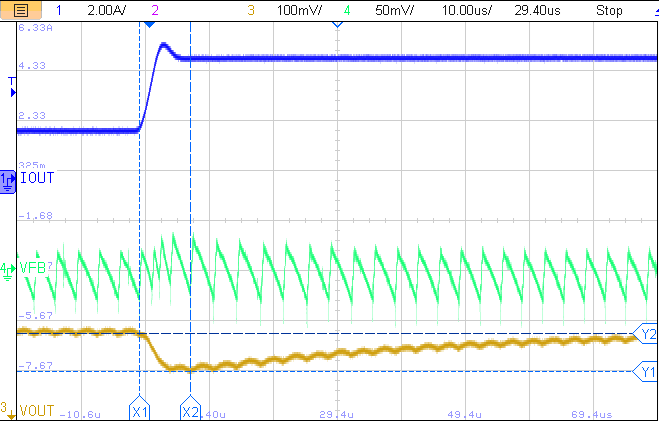
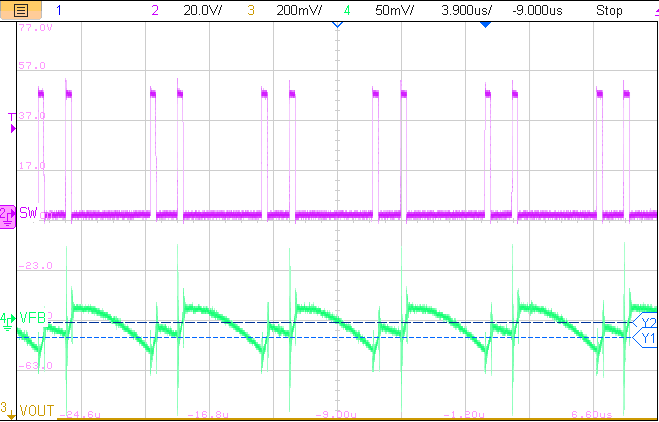
| Figure # | Ripple Injection Components | ZB/ZF Ratio | ΔVFB (mV) | VOUT Undershoot (mV) | Recovery Time (µs) |
|---|---|---|---|---|---|
| Figure 5-2 | RINJ = 16.2k, CINJ = 0.1 uF, CFF = 4.7 nF | 129 | 245 | 240 | 70 |
| Figure 5-3 | RINJ = 36k, CINJ = 0.1 uF, CFF = 4.7 nF | 286 | 108 | 140 | 40 |
| Figure 5-4 | RINJ = 68k, CINJ = 0.1 uF, CFF = 4.7 nF | 541 | 55 | 100 | 25 |
| Figure 5-5 | RINJ = 82k, CINJ = 0.1 uF, CFF = 4.7 nF | 652 | 45 | 75 | 20 |
Table 5-1 and Figure 5-7 provide a comprehensive summary of how optimizing ripple injection can significantly impact transient performance in ACOT-based converters. Despite ACOT's renowned superiority in transient response compared to its counterparts, there is always room for further optimization and improvement.
As discussed earlier and derived in Equation 1-5, the loop gain of ACOT is heavily influenced by the injection RC impedance (ZB) and the impedance of the feed-forward network (ZF). Hence, the ratio of ZB/ZF plays a crucial role in designing the ripple injection circuit for achieving the best transient response. Because ACOT is a nonlinear ripple-based control method, Bode plot measurements must be interpreted carefully and should not be used as the only validation method. Frequency-domain measurements are useful for understanding loop bandwidth and phase behavior, but final stability validation should always include time-domain tests such as load transient response, feedback ripple observation, and switching behavior.