
3.3.3 Set Up and Connect the Power Board Visualizer
Upon establishing the hardware connections and launching the Power Board Visualizer Project, the user will be presented with the project dashboard.
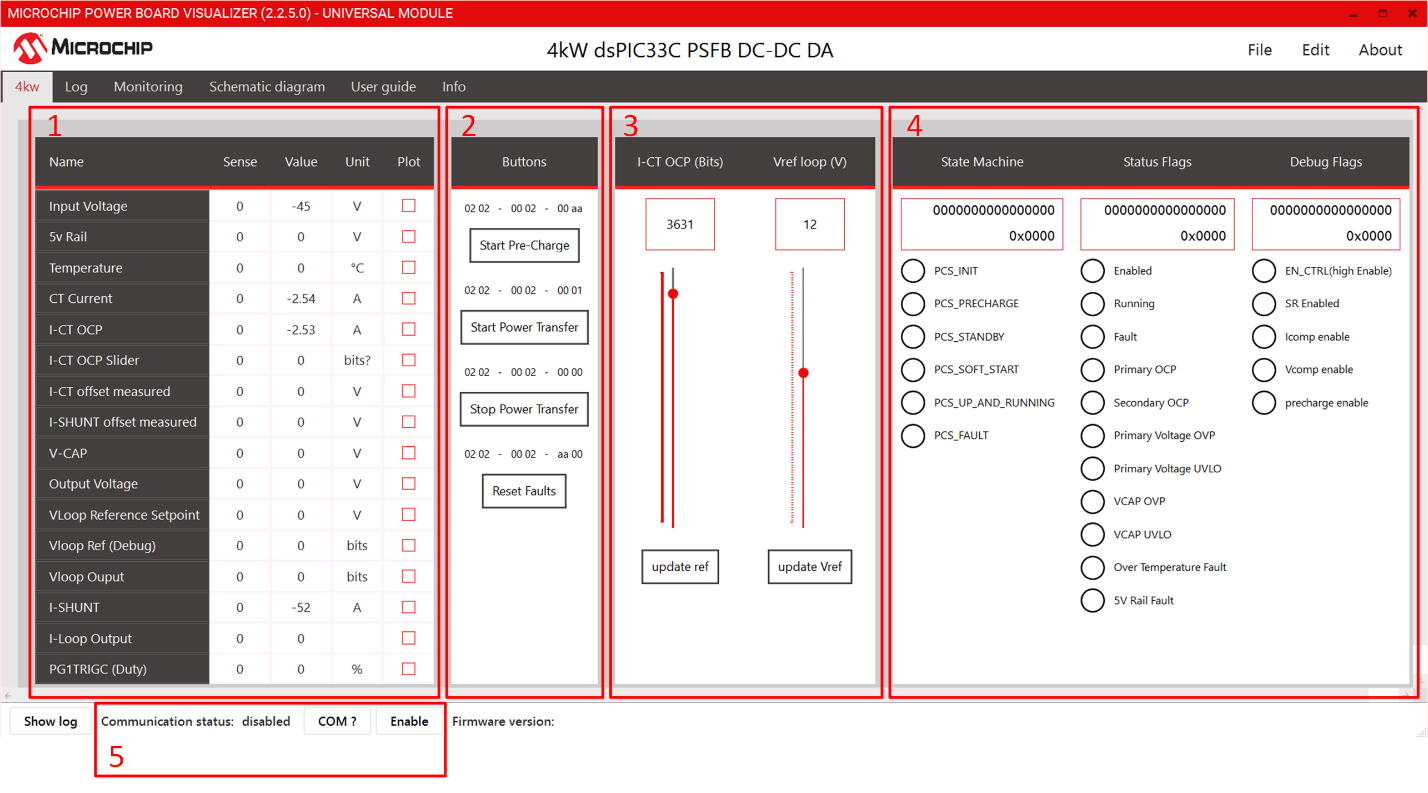
The dashboard has five distinct sections:
- A table to monitor the system values in real time.
- Buttons to start/stop the power transfer.
- Sliders to provide reference values.
- System State and debug information
- Communication status