9 How to Debug in MPLAB X IDE
For debugging / programming, the platform offers the flexibility either to use the integrated PICkit On Board (PKOB) debugger through the Debug USB interface or either use In-Circuit Serial ProgrammingTM (ICSP) Header for External programmer/debuggers
Hardware Tools
All MPLAB® Development Ecosystem hardware tools use in-circuit serial programming (ICSP) for communication with a PIC MCU target. This is also called standard communication.
Current tools:
MPLAB Snap In-Circuit Debugger
MPLAB PICkit™ 4 In-Circuit Debugger
MPLAB ICD 4 In-Circuit Debugger
MPLAB X IDE Debug Startup Options
When a debug session is started MPLAB® X IDE's default mode is to immediately begin executing the application after the target board has been programmed. Some developers wish to change this mode so that the program 'waits' for the developer to signal the application to begin executing. Pausing execution after programming allows the developer to ensure the test platform is correctly set up prior to the application executing. You can change the Debug Startup option by following these steps:
Open the Project Properties Window
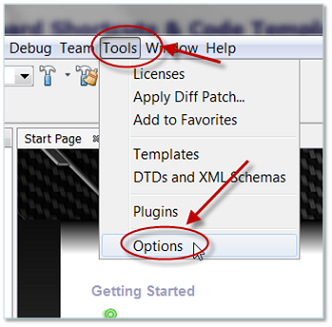
MPLAB X IDE's debug startup option is configured in the Options window.

Select the Debug Options
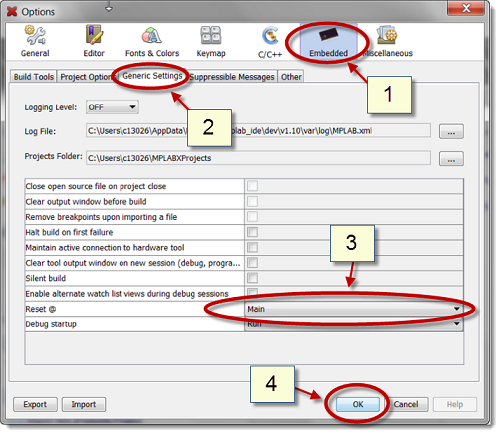
When the options window opens the following needs to be done
Select the Embedded icon (shown here highlighted in Blue).
Go to the 'Generic Settings' tab.
Select from the 'Reset @' drop down menu the desired Debug Startup Option
to pause at RESET
to pause at beginning of main ( shown below)
to run
Click on OK when you are done selecting.

MPLAB® X IDE Debug Toolbar
The debug toolbar of MPLBA X IDE is shown below. The debug toolbar will not be visible when you first launch MPLAB® X IDE. It will appear automatically when you start a debug session.

Keyboard:
| Tool | Symbol | Description |
|---|---|---|
| Stop |  | Ends the current debug session and closes the connection to the debug tool. |
| Reset |  | Performs processor reset. Additional resets, such as POR/BOR, MCLR, and System, may be available, depending on the device. |
| Pause |  | Pauses the debugging operation without finishing the session. Debug windows such as memory views and watches will be updated to reflect the current state of the device. |
| Continue |  | Resumes debugging until the next breakpoint or the end of the program is reached. |
| Step Over |  | Executes one source line of the program. If the line is a function call, executes the entire function then stops |
| Step Into |  | Executes one source line of the program. If the line is a function call, executes the program up to the functions's first statement and stops. |
| Run to Cursor |  | Runs the current project to the cursor's location in the file and stops program execution. |
| Set PC at Cursor |  | Sets the program counter (PC) value to the line address of the cursor. |
| Focus Cursor at PC |  | Moves the cursor to the current PC address and centers this address in the window. |
Starting A Debug Session
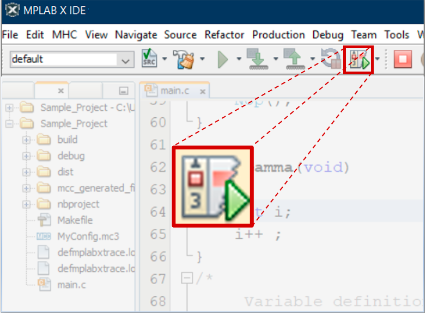
After ensuring the desired debug startup option has been set and ensuring the desired debugging tool has been selected, you can start a debug session by clicking on the Debug Project icon.
When a debug session has been initiated:
The project will build.
MPLAB® X Integrated Development Environment (IDE) will connect to the selected debug tool and download the built image.
The Debug Icons will appear on the Toolbar.
The application in the device will run according to the debug startup option.

MPLAB® X IDE Breakpoints
A breakpoint is a mechanism for pausing the application during a debug session. When the application is paused, the developer has the opportunity to view and modify data variables, non-volatile memory data and device registers.
Each of the Integrated Development Environment's (IDE) six breakpoint types will pause the application when a certain set of criteria are met. MPLAB X IDE supports the following breakpoint types:
Line Breakpoint - Activates when the program execution reaches a selected line of source code.
Address Breakpoint - Activates when a specific address of program memory is executed. An address breakpoint differs from a line breakpoint when a single line of source code requires multiple lines of machine language instructions to execute. Address breakpoints allow the application to be paused on specific assembly language instructions.
Data Breakpoint - Activates when a specific data memory (RAM) is accessed under certain criteria. Data breakpoints can be triggered when an address is written to or read from. Data breakpoints can also be set to activate when a specific value is read from or written to data RAM.
Event Breakpoint - Breaks when a specific device event occurs, such as Watchdog Timeout, Reset, or Sleep Instruction execution.
Sequence Breakpoint - Breaks when two separate breakpoint criteria occur in an ordered sequence.
Tuple Breakpoint - Breaks when a specified data breakpoint and a specific address breakpoint are both set. Tuple breakpoints are useful in determining if a certain value was read by or written by a specific application function.
For more information on breakpoints, refer this Document .
