
6 Plotting Graph in Data Visualizer
The following instructions show how to plot USART data in Data
Visualizer by using the Data Stream protocol.
- Open Data Visualizer.
- Open in Data Visualizer.
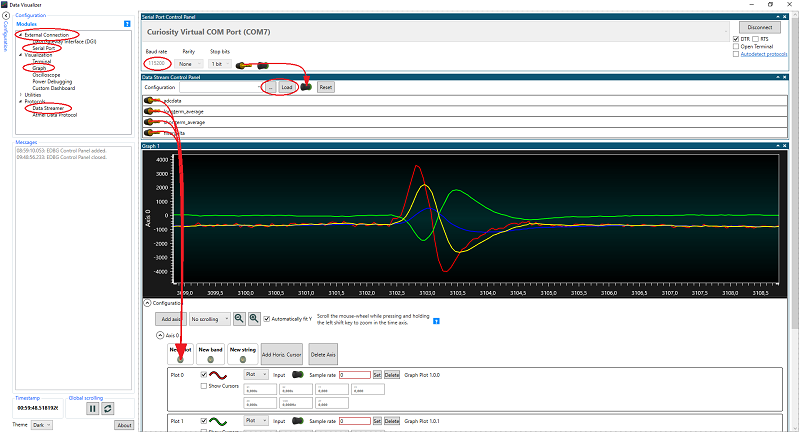
- Select the Curiosity Virtual COM port, Baud rate: 115200, and then select Connect.
- Open .
- In the Data
Stream Control Panel, under
Configuration, browse to the
configuration file and then select Load.Note: In this case, the configuration file is
tiny2_PIR_datastreamer.cfgand can be found in the example source code project folder.Note: For more details on the Data Stream Protocol, refer to Data Visualizer User's Guide, Data Stream Protocol section.
- Open .
- Drag the connections, as shown with red arrows in the figure below, to plot the graph.
To adjust the Y-axis in the graph, follow the steps below:
- Under Configuration in Graph, deselect Automatically Fit Y.
- Click somewhere inside the plot area.
- Scroll the mouse-wheel while pressing or holding the Ctrl key.
To adjust the X-axis in the graph, follow the steps below:
- Click somewhere inside the plot area.
- Scroll the mouse-wheel while pressing or holding the Shift key.
Note: For more details on , refer to the Data Visualizer User's
Guide, Graph section.