
1.2.7.6 TOU and Energy Registering
TOU stands for Time of Use, and it is a relevant concept in the smart energy meters. The energy consumption is assigned and grouped into different time periods. These periods correspond to intervals within the day, to special days (for example, weekends) or seasons (for example, summer). Each time period has an associated rate for billing purposes.
The application provides a simple implementation that can be easily modified. Specifically, the day hours are divided into several time periods (maximum 8). Each time period is associated to an identifier (maximum 4) and corresponding to a rate. As an example, suppose three rates are defined:
- Id 1: Peak rate, corresponding to peak times and having the higher prices. It is the red zone of the graph, from 9:00 to 16:00.
- Id 2: Medium rate, related with intermediate prices. It is the yellow zone of the graph, from 5:00 to 9:00 and from 16:00 to 20:00.
- Id 3: Valley rate, with lower prices. It is the green zone of the graph, from 20:00 to 5:00.
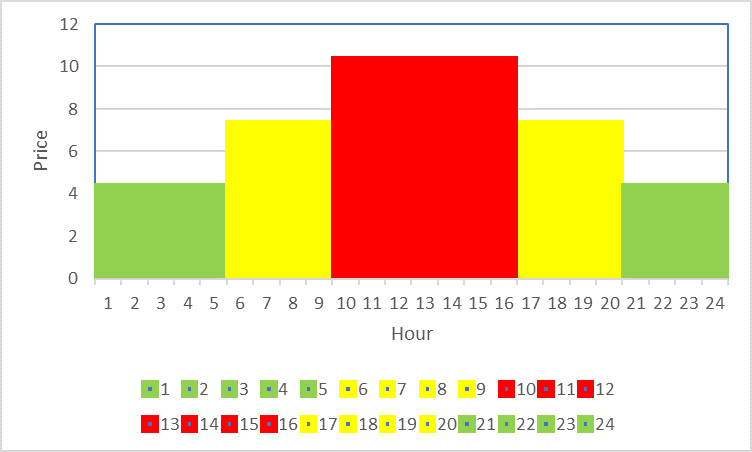
Therefore there are 3 rates and 4 time periods. The TOUW command is used to define the time periods and to assign the rate by means of its identifier. The command to be sent is: TOUW[PIC](05:00 02 09:00 01 16:00 02 20:00 03).
The metrology library is continuously measuring energy, and the application accumulates the energy in the proper rate identifier according to the real time clock information. This way, all the energy registered in the red area is accumulated in rate 1 (T1), the energy in the yellow areas in rate 2 (T2), and the energy in the green areas in rate 3 (T3).
Here is a simple example:
- Write the new TOU
table
TOUW[PIC](05:00 02 09:00 01 16:00 02 20:00 03) Set TOU is Ok !· - Erase the energy records in the
meter
ENC[PIC] Clear Energy is ok ! ENR[0] Last 0 Month Energy is : TT=0.0kWh T1=0.0kWh T2=0.0kWh T3=0.0kWh T4=0.0kWh - Read the
RTC
RTCR Present RTC is : 20-07-28 2 04:58:04 - The present time corresponds to rate
3 (green area), but soon the system will enter in rate 2 (yellow area). The user
energizes the meter test bench to force the board to register energy. Then, the user
reads the energy register and the RTC several times to see how the energy measured
is being registered and assigned to the proper rate.
ENR[0]
Last 0 Month Energy is :
TT=0.01kWh T1=0.0kWh T2=0.0kWh T3=0.01kWh T4=0.0kWh
RTCR
Present RTC is :
20-07-28 2 04:58:41
ENR[0]
Last 0 Month Energy is :
TT=0.04kWh T1=0.0kWh T2=0.0kWh T3=0.04kWh T4=0.0kWh
RTCR
Present RTC is :
20-07-28 2 04:59:13
ENR[0]
Last 0 Month Energy is :
TT=0.07kWh T1=0.0kWh T2=0.0kWh T3=0.07kWh T4=0.0kWh
RTCR
Present RTC is :
20-07-28 2 04:59:47
The application is assigning all the energy measured to rate 3 (T3). The other rates remain at 0 kWh.
- The time zone will change to the
yellow area. The user continues reading:
ENR[0]
Last 0 Month Energy is :
TT=0.09kWh T1=0.0kWh T2=0.01kWh T3=0.08kWh T4=0.0kWh
RTCR
Present RTC is :
20-07-28 2 05:00:22
ENR[0]
Last 0 Month Energy is :
TT=0.11kWh T1=0.0kWh T2=0.03kWh T3=0.08kWh T4=0.0kWh
RTCR
Present RTC is :
20-07-28 2 05:00:42
The system changed to the yellow area; therefore, the energy is assigned to rate 2 (T2). TT registers the total energy.