6 Appendix
Schematic, Assembly Drawing, Adapter Pinout, Programming External MCUs, External Debuggers
6.1 Schematic
6.2 Assembly Drawing
6.3 Curiosity Nano Base for Click boards™
6.4 Programming External Microcontrollers
Use the on-board debugger on PIC18F16Q20 Curiosity Nano to program and debug microcontrollers on external hardware.
6.4.1 Supported Devices
All external AVR microcontrollers with the UPDI interface can be programmed and debugged with the on-board debugger with Microchip Studio.
External SAM microcontrollers having a Curiosity Nano Board can be programmed and debugged with the on-board debugger with Microchip Studio.
PIC18F16Q20 Curiosity Nano can program and debug external PIC18F16Q20 microcontrollers with MPLAB X IDE.
6.4.2 Software Configuration
No software configuration is required to program and debug the same device mounted on the board.
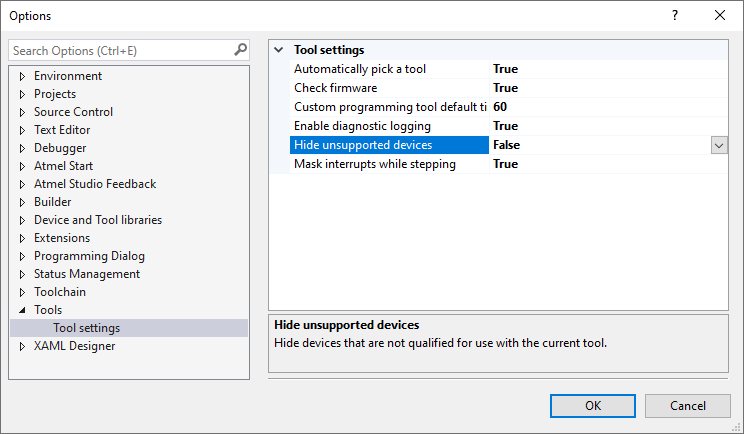
To program and debug a different microcontroller than the one mounted on the board, configure Microchip Studio to allow an independent selection of devices and programming interfaces.
- Navigate to through the menu system at the application top.
- Select the category in the options window.
- Set the Hide unsupported devices option to False.

6.4.3 Connecting to External Microcontrollers
The figure and table below show where to connect the programming and debugging signals to program and debug external microcontrollers. The on-board debugger can supply power to the external hardware or use an external voltage reference for its level shifters. Read more about the power supply in Power Supply.
The on-board debugger and level shifters actively drive data and clock signals used for programming and debugging (DBG0, DBG1, and DBG2). Pull-down resistors are required on the ICSP™ data and clock signals to debug PIC® microcontrollers. All other interfaces are functional with or without pull-up or pull-down resistors.
DBG3 is an open-drain connection and requires a pull-up resistor to function.
PIC18F16Q20 Curiosity Nano has pull-down resistors R100 and R101 connected to the ICSP data and clock signal (DBG0 and DBG1). A pull-up resistor R102 is connected to the MCLR signal (DBG3). Assembly Drawing in the appendix shows the location of pull resistors.
- Connect GND and VTG to the external microcontroller
- Tie the VOFF pin to GND if the external hardware has a power supply
- Make sure there are pull-down resistors on the ICSP data and clock signals (DBG0 and DBG1) to support the debugging of PIC microcontrollers
| Curiosity Nano Pin | UPDI | ICSP™ | SWD |
|---|---|---|---|
| DBG0 | UPDI | DATA | SWDIO |
| DBG1 | — | CLK | SWCLK |
| DBG2 | — | — | — |
| DBG3 | — | MCLR | RESET |
6.5 Connecting External Debuggers
Even though there is an on-board debugger, external debuggers can be connected directly to the PIC18F16Q20 Curiosity Nano to program/debug the PIC18F16Q20. When not actively used, the on-board debugger keeps all the pins connected to the PIC18F16Q20 and board edge in tri-state. Therefore, the on-board debugger will not interfere with any external debug tools.
6.6 Disconnecting the On-Board Debugger
The on-board debugger and level shifters can be disconnected from the PIC18F16Q20.
The power supply block diagram (Figure 4-5 4-7) shows all connections between the debugger and the PIC18F16Q20. The signal names are also printed in silkscreen on the top or bottom side of the board.
To disconnect the debugger, cut the GPIO straps shown in Cut Straps.
