
10.2.3 Viewing Component Status in the Storage Dashboard
The Storage Dashboard provides detailed information about the components of the storage space, including local and remote systems, controllers, arrays, logical drives and NVMe SSDs. Occupying the largest portion of the main window in maxView Storage Manager, the Storage Dashboard organizes component information by category, with tabs providing one-click access to summary information and status, properties, resources, and usage statistics.
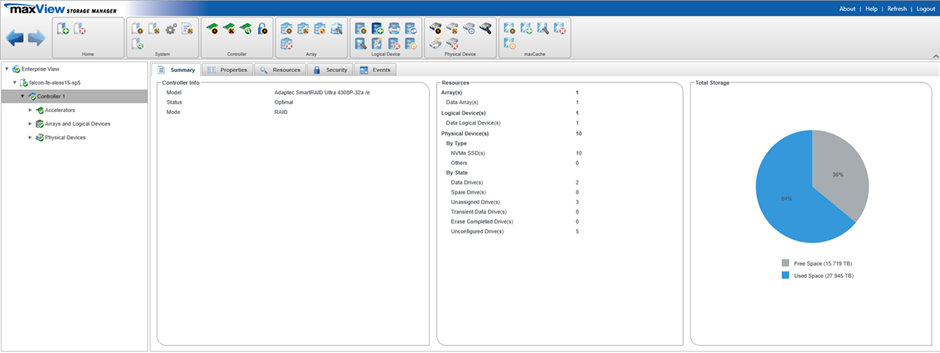
The information on the Storage Dashboard varies, depending on which component is selected in the Enterprise View. The figure below shows the Storage Dashboard for a controller. Tabs provide access to summary information, controller properties, and resources. The Events tab shows filtered events for the selected device (see Viewing Activity Status in the Event Log).
The following table lists the categories and types of information provided on the Storage Dashboard for each component in the storage space. All top-level nodes in the Enterprise View (System, Controller, Arrays, Logical Drives, Physical Devices, and so on) include a Summary tab and Events tab.
Component | Categories/Tabs | Examples |
|---|---|---|
| System | Summary Resources | Status, System Name, IP Address, OS Type, Number of Controller(s), Redfish
Server Version, Redfish Server Port ,Installation Type, Save Events to OS Log, Sound
Alarm Device Model WWN State Firmware Version Driver Version |
| Controller | Summary Properties Resources | Model, Status, Mode, Driver Version, Driver Name, I2C Address, Reboot Required Reasons Number of physical drives, arrays, logical drives, and status Data Protection features Consistency Check Priority, Consistency Check Delay, Parallel Consistency Check Count, Consistency Check Inconsistency Notify, Spare Activation Mode Performance optimizations and other settings Physical drive assignments by logical device (see Revealing More Device Information ) |
| Accelerator | Summary | Accelerator ID, Serial Number, WWN, Physical Slot, Temperature, Power Consumption, Negotiated PCIe Data Rate, PCI Address (Domain:Bus:Device.Function), NOR Flash Type, Firmware Version, Hardware Revision, Hardware Minor Revision, CPLD Revision |
| Arrays |
Summary Resources | ID, Name, Device Type, Interface Type, Total Space, Used Space, Unused Size,
Member Device(s) Block Size Spare rebuild mode Logical drive RAID level, size, status |
| Logical drives |
Summary Resources |
Raid level, segment and group (RAID 10 only), size, mount point, status Member drives and sizes |
| NVMe SSDs | Summary Properties Resources SMART Error Counter | Vendor, Model, Serial Number, Interface type (NVMe SSD), Total Size,
Logical/Physical Block Size Sanitize Erase, Encryption Capability Drive state (Ready, Optimal, Hot Spare), mount point Channel number and device ID Transfer speed Drive segment allocation SMART statistics (see Viewing SMART Statistics) |