7.3.2 Feature Visualization
This provides feature visualization through a 2D comparison plot, enabling users to assess class separation and identify potential feature conflicts, aiding in feature selection and model refinement.
- Open the Explore Model section and click Feature Visualization.
- Change the feature on each axis to see the
different comparisons. The following examples show examples for the current
model.
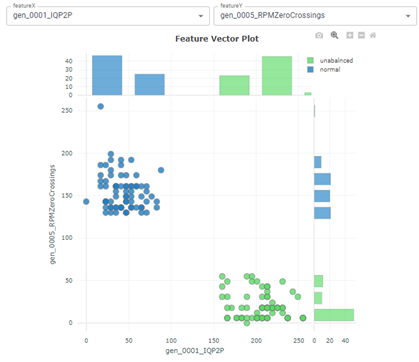
Figure 7-16. IQP2P vs RPMP2P 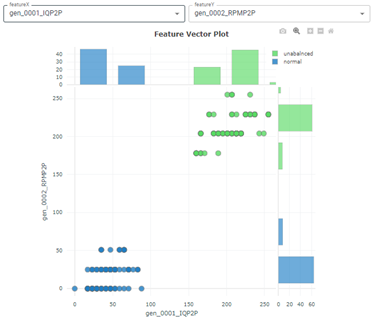
Figure 7-17. IQP2P vs IQZeroCrossing 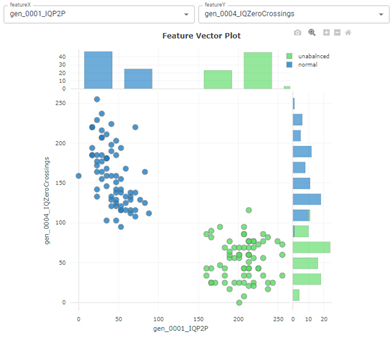
Figure 7-18. IQP2P vs RPMZeroCrossing