
4 Graphics
MPLAB MTCH9010 Plugin allows the user to visualize the data through a graphical interface in the Time Plot window. The plugin facilitates the graphical representation of all four values:
- Reference: The value measured with a completely dry sensor or an initial desired sensor state
- Data: The standard value measured on the sensor
- Threshold: The set value at which liquid detection is triggered
- Delta: The value obtained by subtracting the reference value from the standard measurement value
The user can select the values to be plotted in three different methods.
The first method is to select the Plot All Variables button, located next to the MTCH Session.
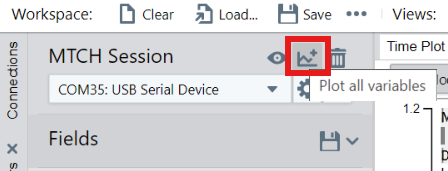
All four values are represented in the Time Plot window. On the right side of the Time Plot window is the Visualization Control Panel, used to control the graphing of streaming data. The Reference, Data and Threshold are plotted on the same axis and the Delta is plotted on a different axis.

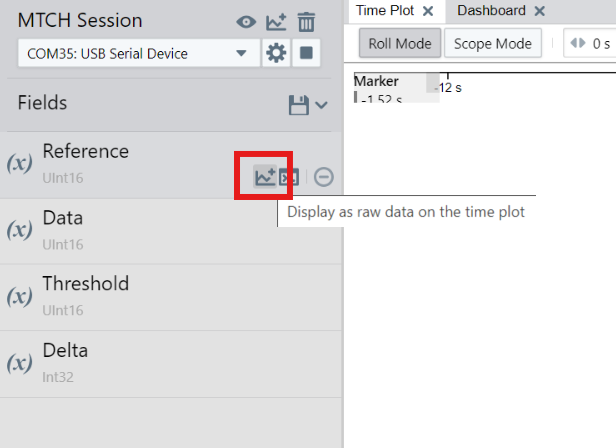
The second method is to select each value from the Fields section. For each parameter, select
the  button to display and plot the
raw source data.
button to display and plot the
raw source data.
As is shown in the Visualization Control Panel, there are four different axes, each corresponding to one of the four values. This setup allows users to visualize and compare these values simultaneously or individually.

The third method is to select the values from the Visualization Control Panel. Initially, no source is selected for data plotting.

To add a value to the graph, select from the Data Source field the desired parameter. For visualizing multiple parameters on the same axis, select Add Plot. For adding another data axis to the graph under current axes, select Add Data Axis and then select which parameters to plot.

After selecting all parameters, data might not be visible. Click the Run Mode button to start plot scrolling. Once selected, the button changes to Running and the data will be visible. Re-click the Running button to stop the plot scrolling.

Refer to the MPLAB Data Visualizer User's Guide for more information about viewing data in the Time Plot.