A Mass Storage Class example is used as an example on how to use the data
polling and control of data variables features. A SAM L21 Xplained Pro board is
connected to a host computer trough both the Target USB and Debug USB connectors on the
kit. The ATSAML21 target device is running the USB Device MSC Example from ASF for SAM
L21 Xplained Pro.
To be able to work through this example, the following is required:
Host computer with Atmel Studio 7 (or
later) installed (Data Visualizer is included)
ATSAML21 Xplained Pro kit
Todo:
Connect both the Target USB
and Debug USB connectors on the SAM L21 Xplained Pro board
This example makes use of the USB Device MSC Example from ASF
for SAM L21 Xplained Pro.
Todo:
In Atmel Studio, create a New Example Project
In the New Example dialog,
select the SAM L21 device family (or other relevant device) and filter by
the keyword “MSC”
Select the USB Device MSC Example
Build the project/solution
(F7)
Todo:
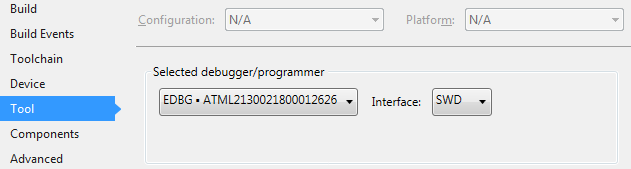
Open the project properties (right click the project in the
Solution Explorer and select
Properties)
On the
Tool tab, select the appropriate tool and
interface
Now see how Data Visualizer can poll variables from
the target and display their values in graphical form.
Important: Data polling is only available when
Data Visualizer is run as an extension within Atmel Studio. This is because it needs
to access the debug system on the device through the Atmel Studio debugger
backend.
First, add a few lines of code containing variables to poll.
Todo: Open
ui.c and add two global variables to the top of the file.
Important: Declaring
variables you are interested in polling as volatile will ensure that they are placed
in SRAM and that their values will not be cached in registers by the compiler.
Registers cannot be polled, only SRAM locations.
Tip: Data polling operates on
absolute SRAM locations. It is thus advised to use global variables for this purpose
so that they are always available at the same location in SRAM. Polling locations in
the stack can yield unpredictable results based on the stack context at the time of
polling.
Todo: Modify the two ̔startʼ functions in ui.c to increment read and write counters on
each access started.
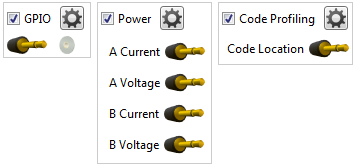
For data polling functionality, enable the Code Profiling interface.
Todo:
Start the Data Visualizer
session
Launch the debug session
using Start Debugging and Break (Alt + F5)
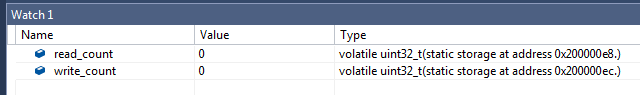
Data polling operates on SRAM locations, so to find out where variables are
located in SRAM we need to use the Atmel Studio Watch window.
Todo:
Locate the two global
variables added to ui.c
Right-click each variable and
select Add to Watch
Examine the type field of
each variable in the Watch window to find its location
Switch back to the Data Visualizer to set up the Code
Profiling interface and to connect the two variables to a graph.
The online versions of the documents are provided as a courtesy. Verify all content and data in the device’s PDF documentation found on the device product page.