1 Overview
This chapter gives an overview of the main modules/features of the Data Visualizer. Each module is described in a separate chapter with technical details of the module, and includes an example or use case showing how to use the module. As each chapter is self-contained, it is possible for the user to quickly identify and select the chapter/module of interest.
Data Gateway Interface (DGI)

Data Gateway Interface (DGI) enables bidirectional communication over SPI, I2C, and USART, in addition to GPIO monitoring, power measurement, and code profiling.
Serial Port

Serial Port communicates with any serial port on the system.
Terminal
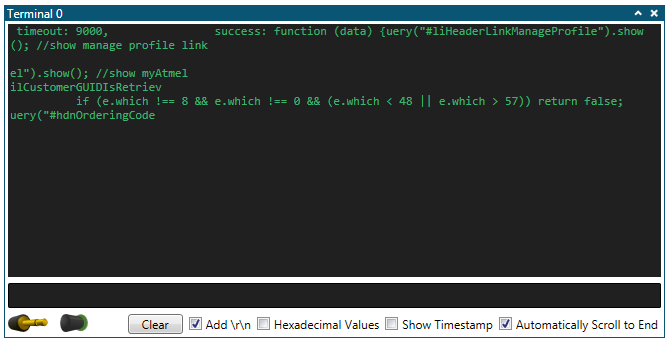
Terminal display and send simple text or numeric values.
Graph
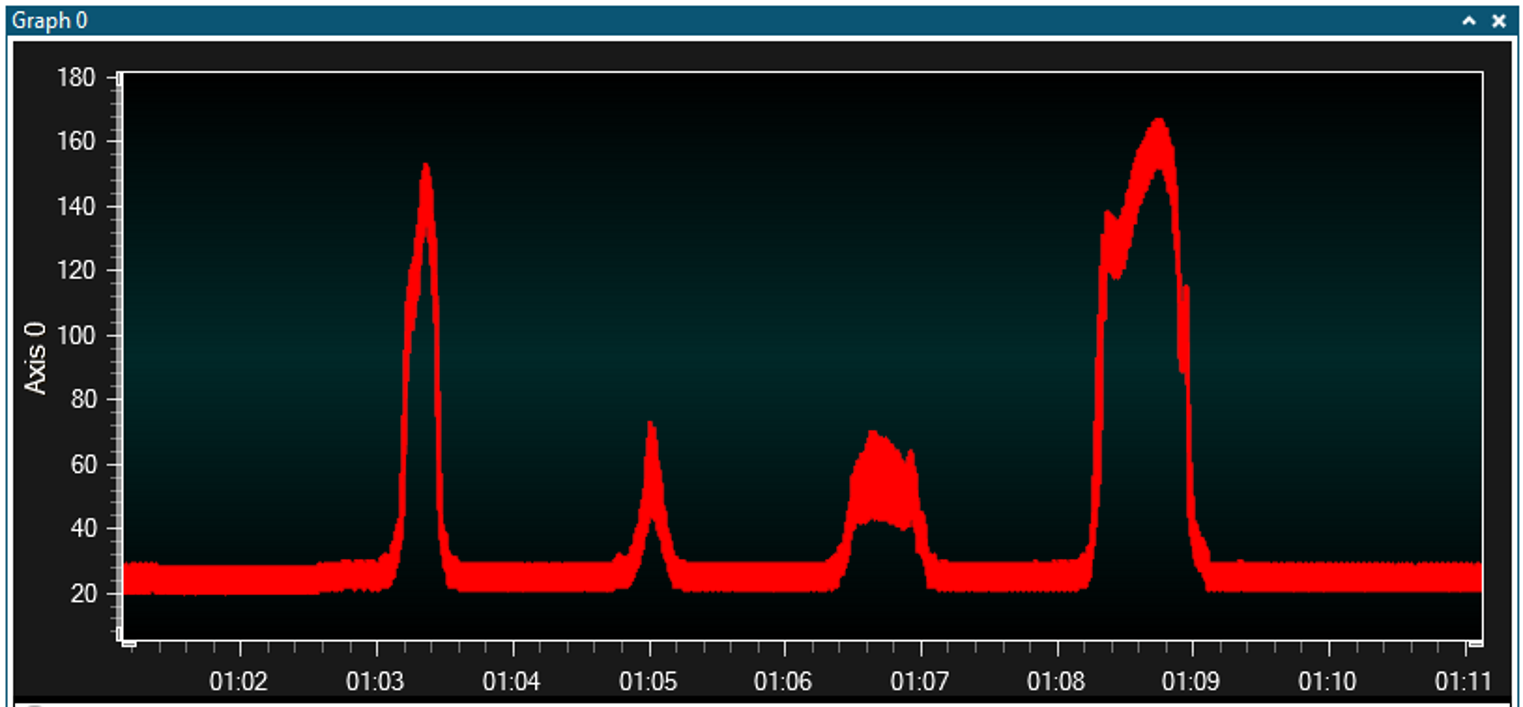
- Cursors (time axis) to measure application timing (e.g., PWM frequency)
- Horizontal cursor (data values) to control an applicationʼs set point or threshold
- Band highlights time periods above customizable thresholds
- String markers can be used to add descriptive text to graphed events
Oscilloscope
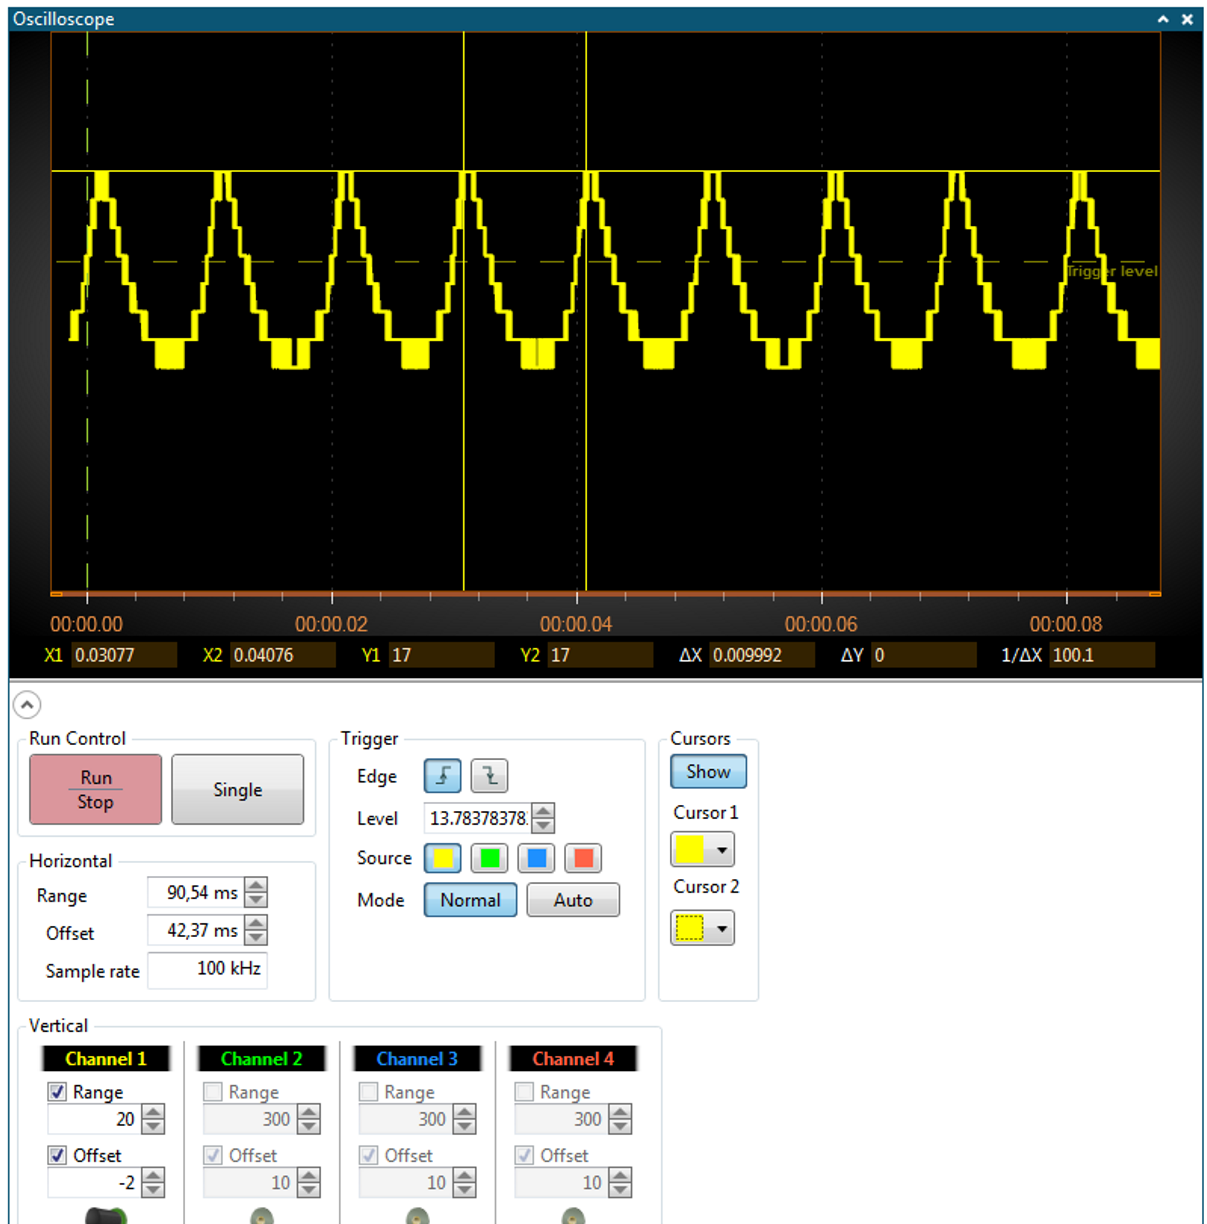
- Edge or threshold triggers on rising or falling edges
- Run-stop control for single shot or continuous triggering
- Cursors (time axis) to measure application timing (e.g., PWM frequency)
Power Debugging
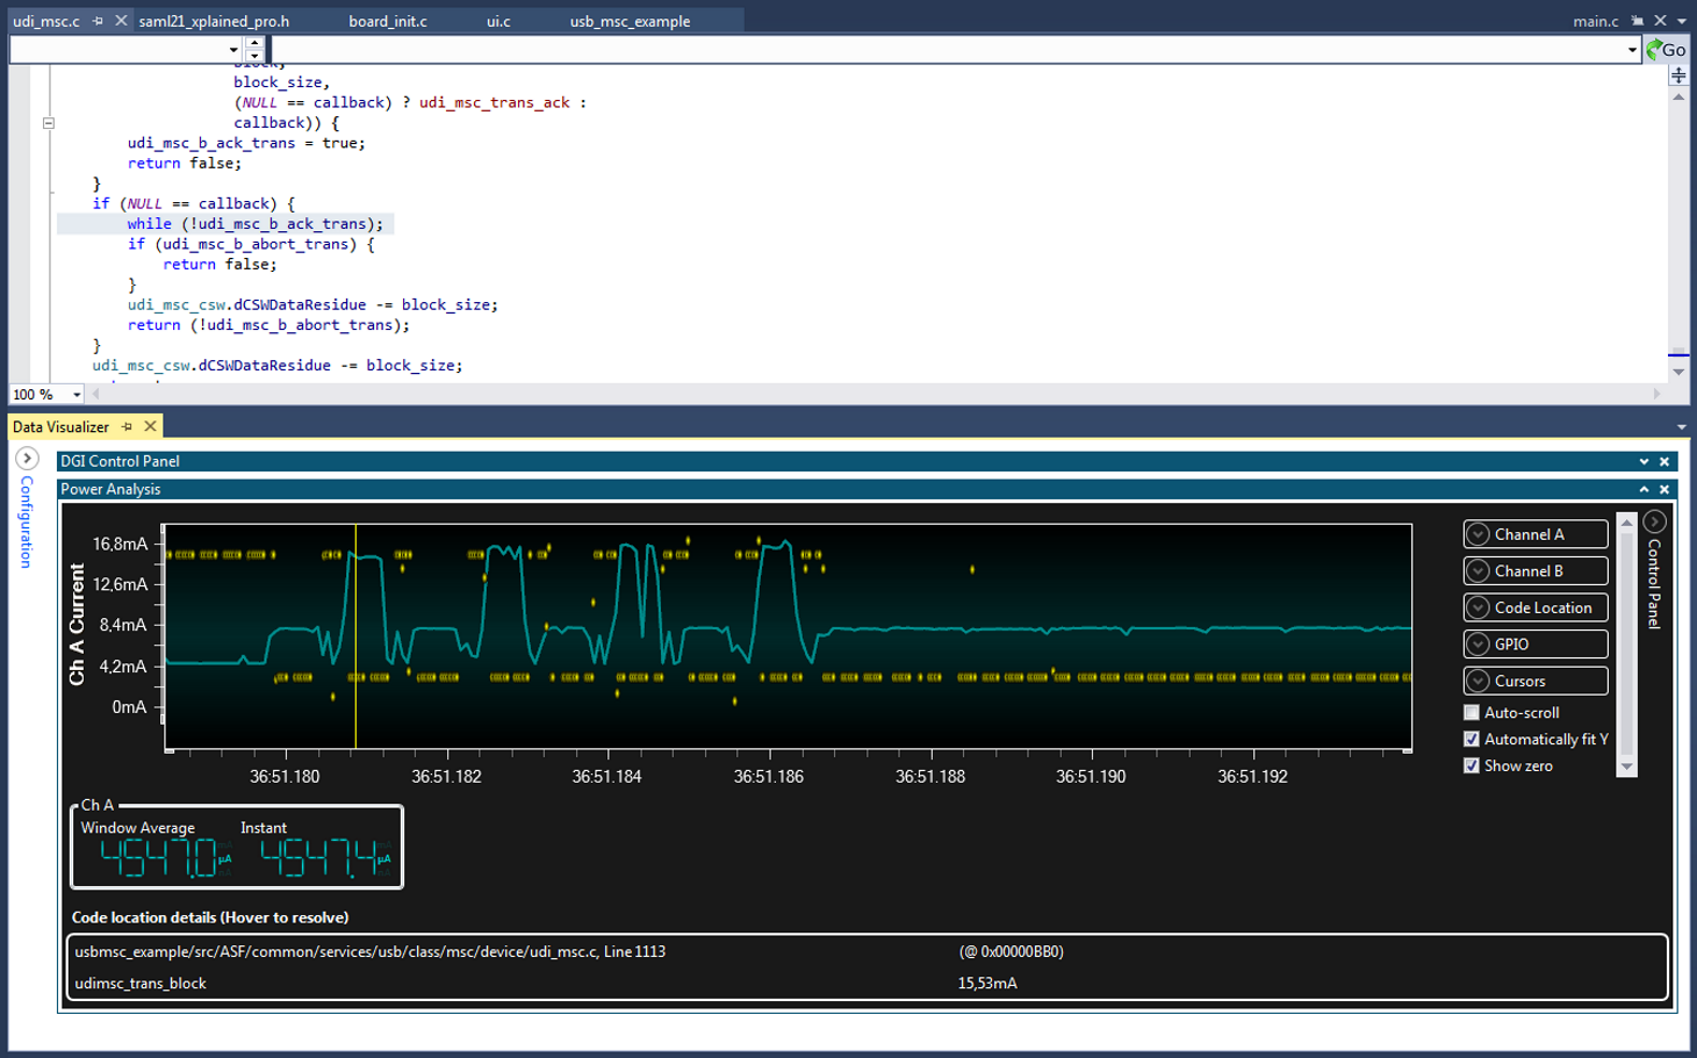
- Correlation of code execution and power consumption
- Displays current and voltage measured using Power Debugger (Embedded debugger on some kits)
Custom Dashboard
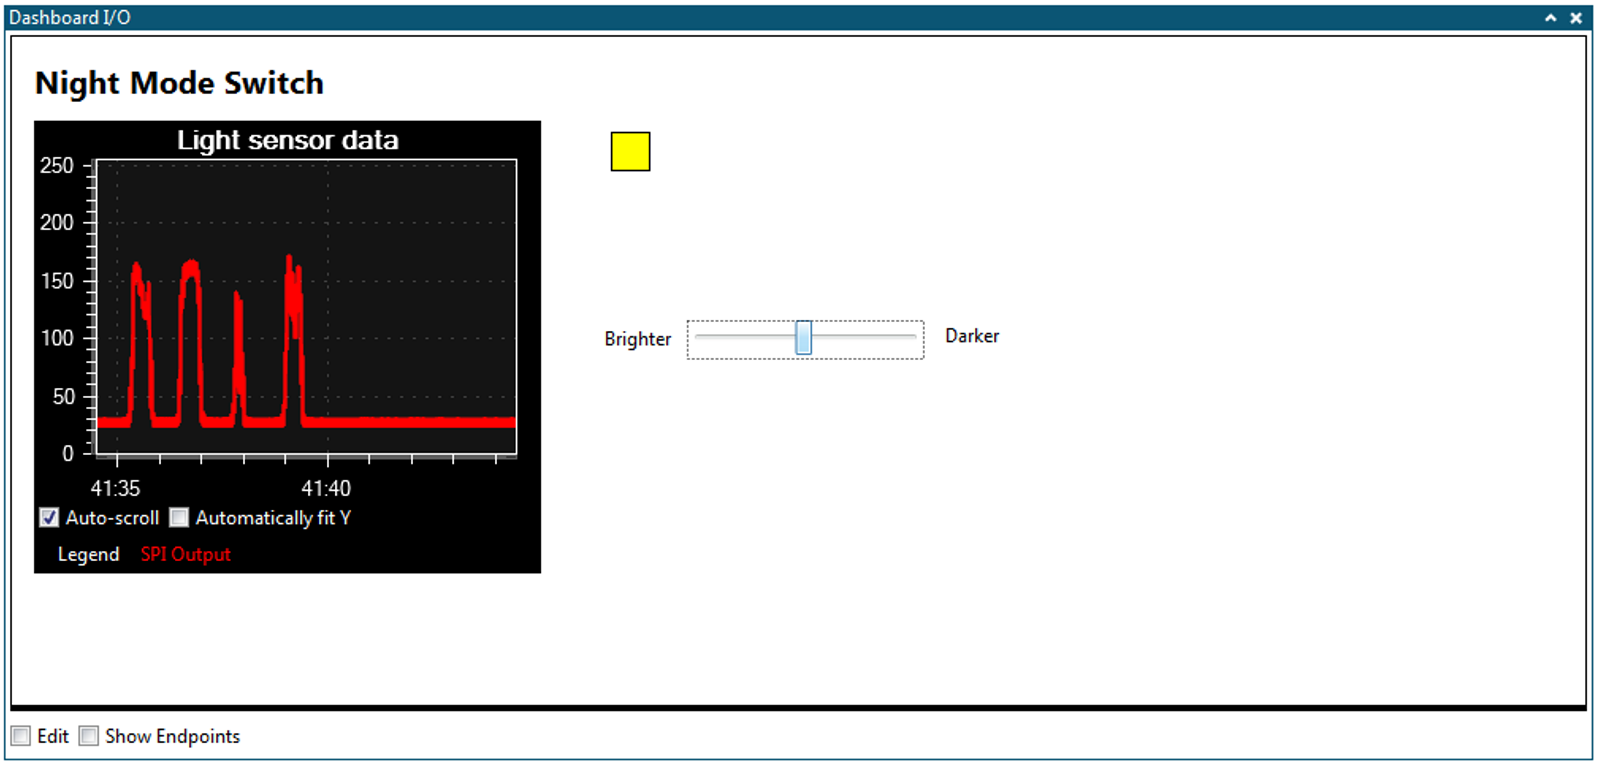
- Build a custom user interface to visualize and control user application using: graph, segment display, binary signals, labels, buttons, linear gauge: Value within defined range. Pie Chart (e.g., for packets lost vs. transmitted in wireless application).
Utilities


- Samplerate Counter to validate MCU frequencies (e.g., rate of transmitted ADC samples)
- File Logger module logs all incoming data to a file of selectable format
Getting Help
Help can be opened at any time by clicking F1. By selecting a module in the Configuration window and clicking F1, help will be opened at the relevant chapter automatically.
Key Concepts
This section describes the key concepts to understand when working with the Data Visualizer.
Workspace
Data Visualizer is made up of several elements such as graphs, interfaces, and controls. All these elements form the workspace.
The elements are called modules, in which any of them can be added to the workspace.
- Expand/Collapse Configuration pane button.
- Configuration and Messages pane.
- Active modules.
- Minimize module button.
- Remove module button.
Connection Overview
The Data Visualizer communicates with the firmware running in the MCU of the embedded system. Variables in the firmware can be transferred in both directions. In the following example, the temperature value is sent to the visualizer and plotted in a graph. The filter strength value is set by dragging the slider in the visualizer, and is then sent to the MCU.
The communication can take place in a serial cable or USB if the embedded system contains an Embedded Debugger. (The Xplained Pro MCU boards contain Embedded Debuggers.)
Embedded Debuggerʼs Data Gateway Interface
The Xplained Pro family of boards contain an Embedded Debugger chip. It has a Data Gateway Interface (DGI) that lets the MCU easily communicate with the Data Visualizer through either its SPI or TWI interface, or by GPIO pins.
In the Data Visualizer, the DGI Control Panel is the module that communicates with the Embedded Debuggerʼs Data Gateway Interface. When the board is connected to the computer with the USB cable, it can be selected in the control panel. A list of available interfaces will appear. Enable one or more of them by checking the boxes. In the figure above, the SPI interface is enabled. The MCU can now communicate with the Data Visualizer on its SPI port.
Simple Transfer
Sending a single value from the MCU to the Data Visualizer is quite simple. In the figure below, the MCU sends the temperature variable over its SPI interface. In the visualizer, the SPI interface on the Embedded Debugger has been enabled. The Embedded Debugger will transmit the SPI data to the visualizer through the DGI Control Panel.
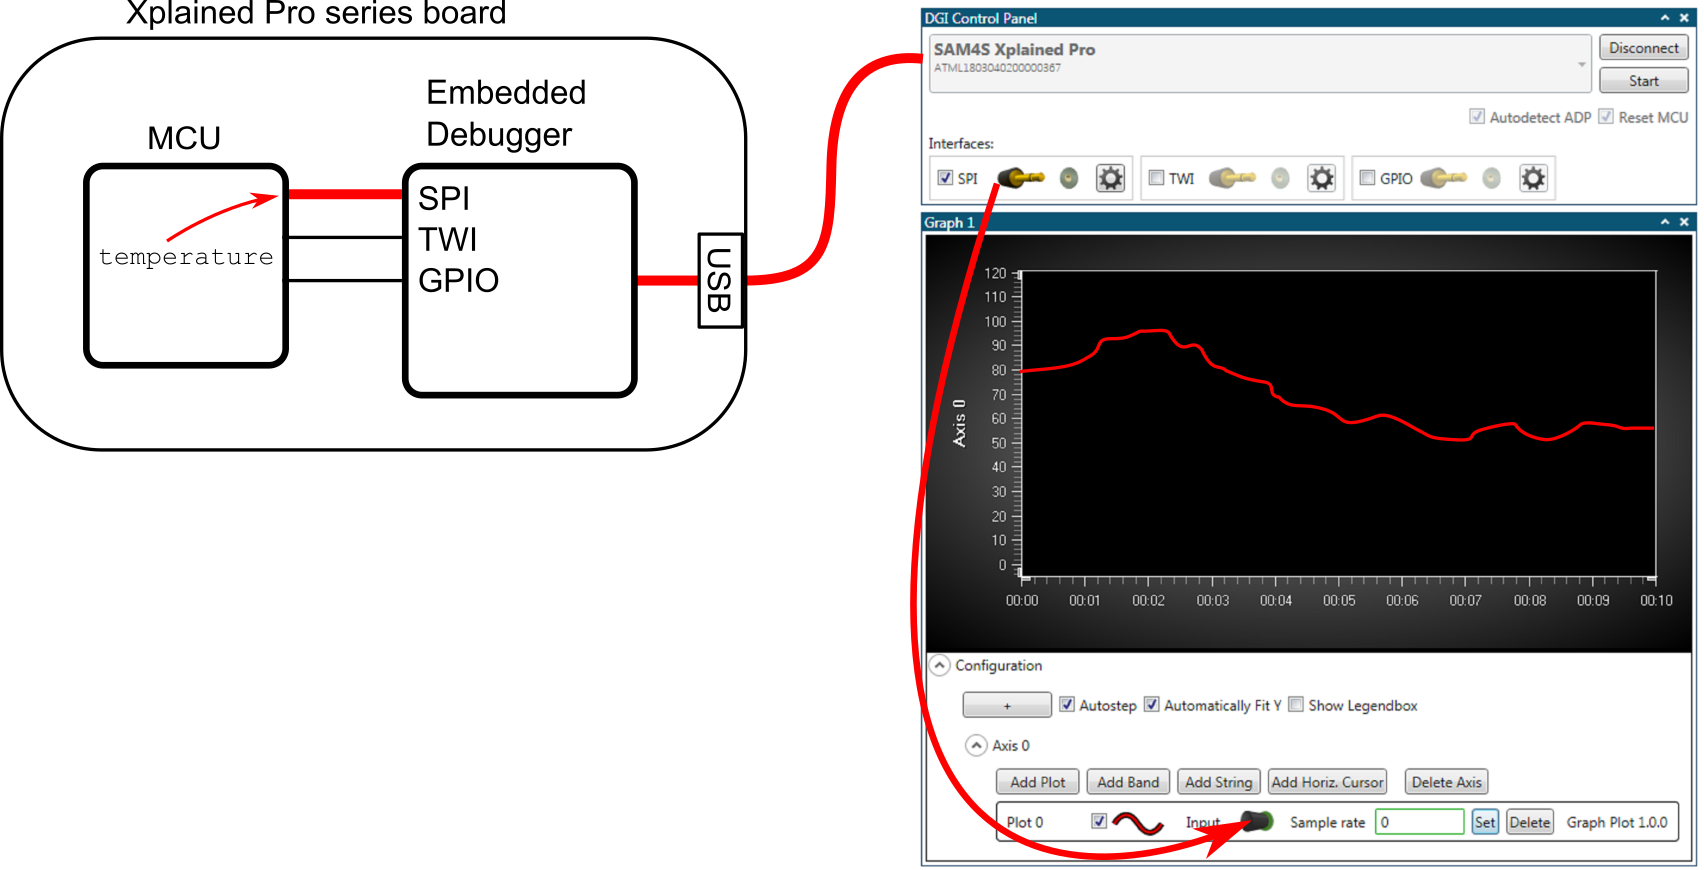
To visualize the temperature data, a Graph has been added. The SPI data is routed to the plot by dragging the plug icon from the SPI interface in the DGI Control Panel, and dropping it in the plot area. This will add a new plot to the Graph module.
Endpoints
Data in the Data Visualizer originates from an endpoint and ends in an endpoint. The endpoints are referred to as sinks and sources. A data source sends data to one or more connected sinks.
In the workspace, the endpoints are represented by the graphical symbols shown below.
Launching Data Visualizer
The Data Visualizer is included as part of the Atmel Studio installer, and can be run either as a Studio extension or in Stand-alone mode.
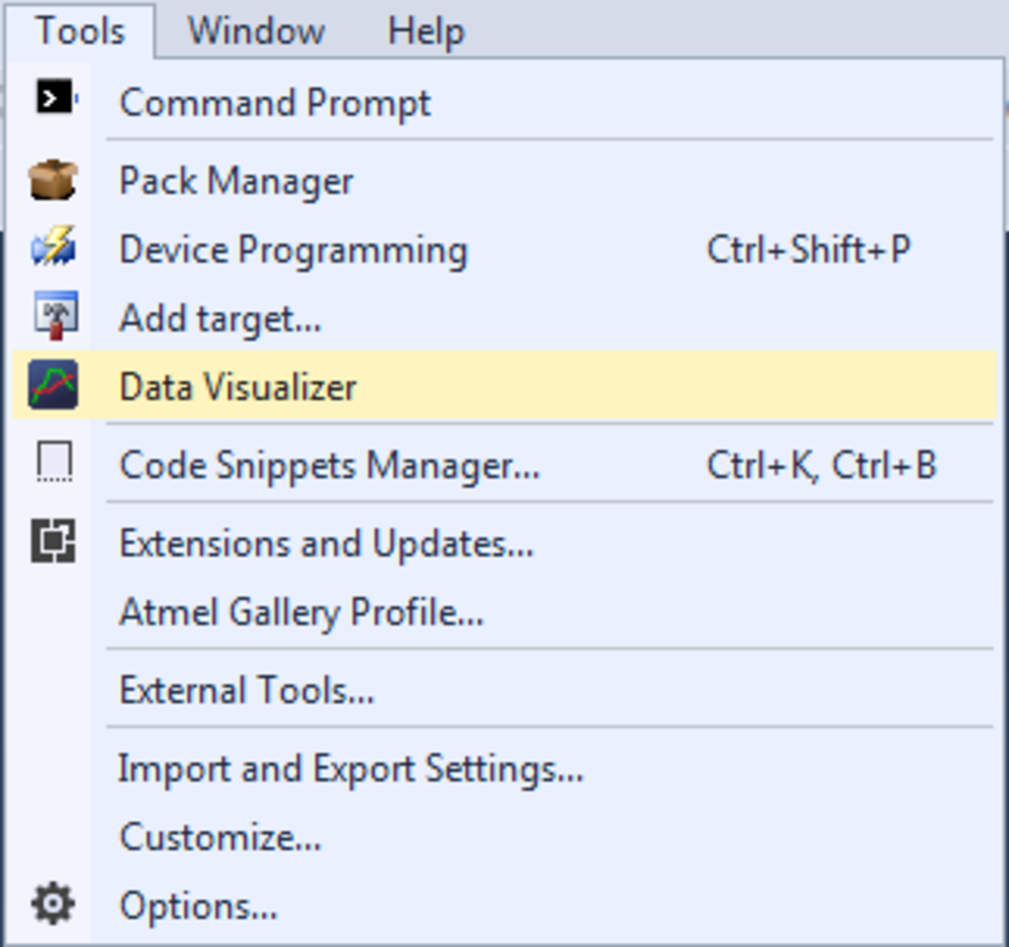
Kits supporting Data Visualizer functionality include a shortcut to the extension on their start page in Atmel Studio.
If the stand-alone version of the Data Visualizer has been installed, look for the shortcut in the Windows® start menu. The stand-alone version is available for download from gallery.atmel.com.
