2 LAB 1: Find and run projects from START’s
example browser
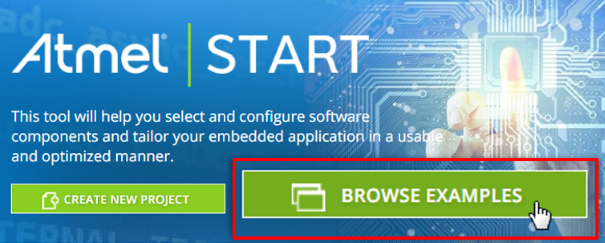
The main objective of this hands-on LAB is to showcase START’s example
browser, to easily find relevant example projects, download, then compile and run in an IDE.
Following the instructions in the example user guide, the project is exported
from START and run in an IDE (a process required to run any of START’s example
projects).
Since LABS 2 and 3 will focus on the Event System and Logic (CCL)
configurator, we should find an example which includes both these Core Independent
Peripherals (CIPs):
Peripheral Event System (EVENTS
Configurator)
Custom Logic (Custom Configurable
Logic - CCL)
In addition, the kit you have, the ATtiny817 Xplained Pro, will be a
further requirement.
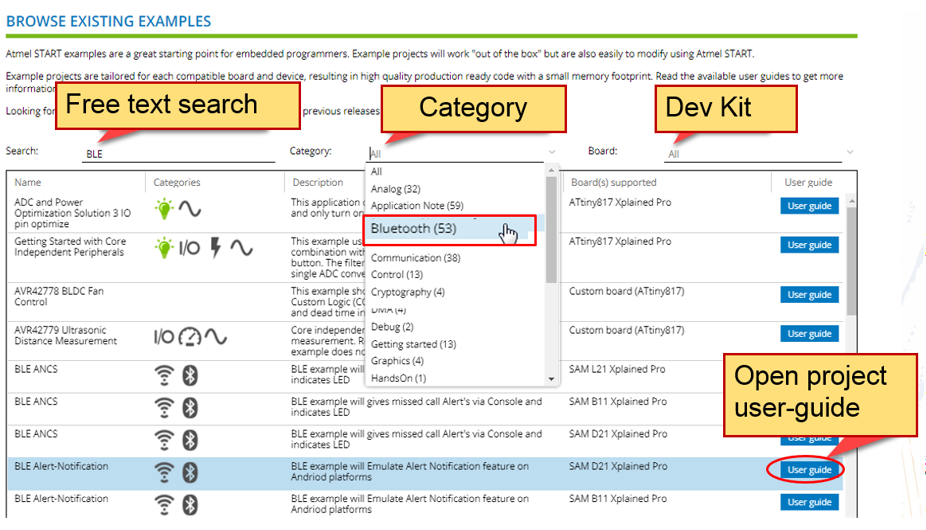
Info: There are three primary filters, which can be used individually
or together:
A free text
search: Searches the project name and long description
Category
search: Lists all projects tagged as belonging to a certain
category/technology
Board: Lists
projects that can run (as is) on a given development kit.
Figure 2-2. Example Project
filters in Atmel START
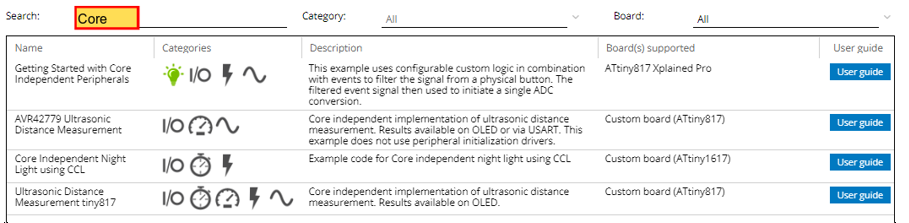
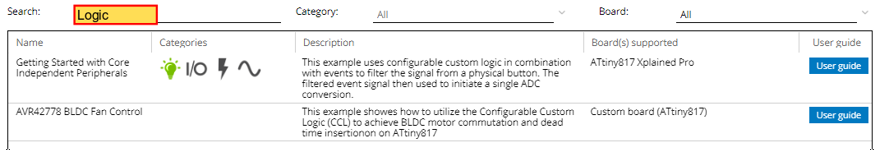
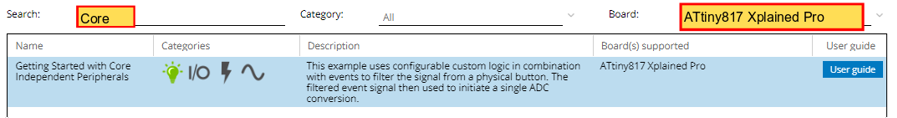
Using the text search for
and searching for “Core” or “Logic”, gives the following
results:Figure 2-3. Text search
using “Core”Figure 2-4. Text search
using “Logic”
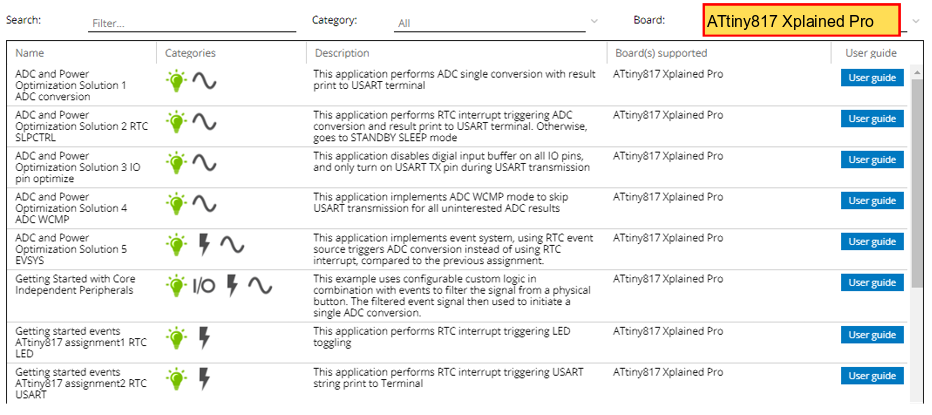
Similarly, the board
filter can be used to find example projects specific to the kit.Figure 2-5. Board
Search
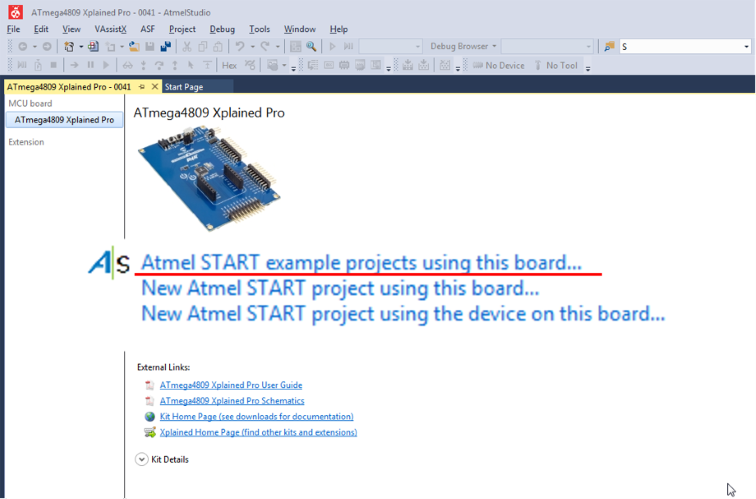
Tip: When clicking on ‘Atmel
START example projects for this board…’ from the Atmel Studio 7 Kit
Welcome Page, the START example browser is opened with the relevant kit
filter applied.
Figure 2-6. START links in kit
welcome page in Atmel Studio 7
Combining the text search
with the board constraint, the project options become quite clear.
Info: The example projects can be
filtered based on the categories where each symbol carries its own annotations to meet our application
requirements. The project can be further filtered by adding “Custom
Logic” into the free text search, “Getting
Started” to the category search and “ATTiny817
Xplained Pro” to the board search.
Figure 2-7. Icon representation of
technologies used in example projectsOur requirements have highlighted a potential project “Getting
Started with Core Independent Peripherals”. The project
description includes both “custom logic” and “events”. It is also
tagged with the “Peripheral Event System” category. Therefore, the
project seems to match our requirements.
Todo: To get the next level of
detail, click on the User guide button, on the right
of the START example browser.
Figure 2-8. User guide of the
shortlisted example
Result: The project is created in
Atmel START and you now have access to the DASHBOARD view:
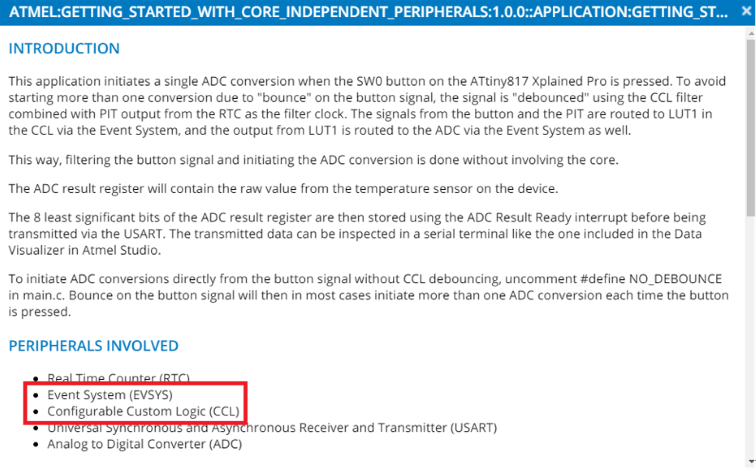
This project utilizes many of the
AVR Core Independent Peripherals (CIP) such as Event system and Custom logic.
Moreover, this example combines the CCL, EVSYS, RTC and ADC to filter the signal
from a button.
Tip:
It is recommended that user guides of example projects in
START have at least the following sections:
Introduction: Describes what the example project
does.
Related
documents/application notes: Will provide links to these
relevant documents.
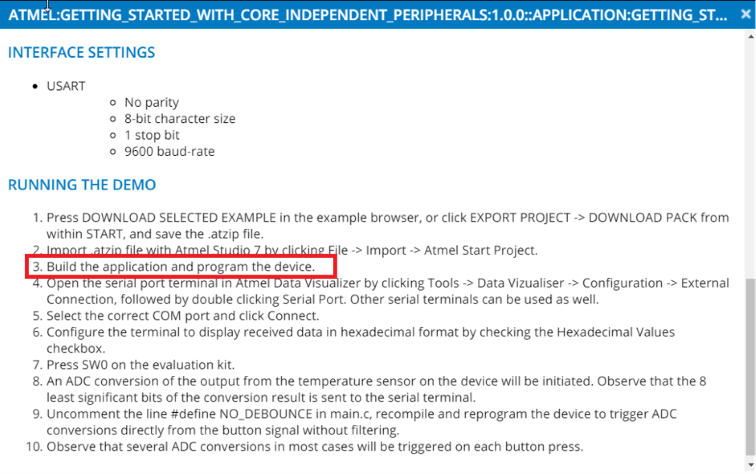
Interface
settings: Any specific configuration, e.g. USART baud
rate
Running the
demo: The last section of the user guide is always a
short list of steps required to run the project (all projects
should be runnable, with very little understanding of how they
work).
Projects in the Getting Started category have links to training
materials, while the application notes category project have links to
application notes.
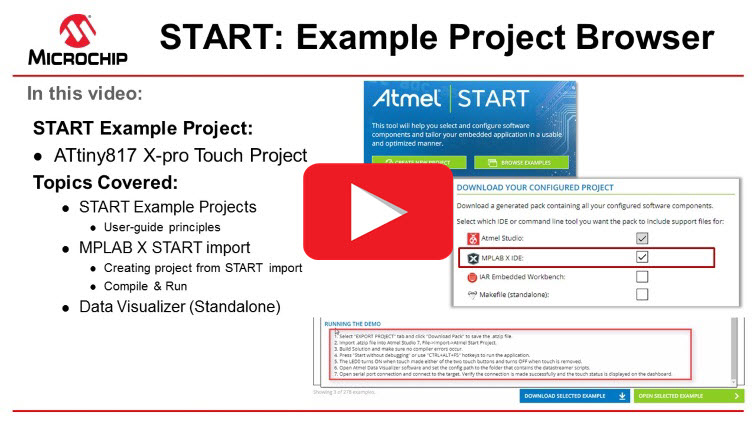
Running the example
project
The “Download Selected Example” option will provide you with the
.atzip format where you can import the project in Atmel
Studio, compile and run the same.
Normally it is recommended to hit the Open Selected
Example and observe the graphical view of the peripherals. This will
also allow you to make modifications to the project configuration.
However, from an understanding of what this example project does, the
configuration will later be explored. So initially the steps to simply run the demo
will be followed.
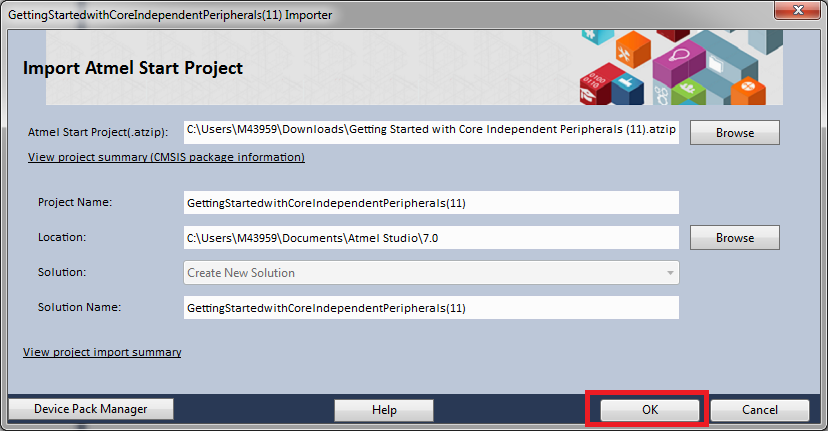
Todo: Follow steps 1 and 2, leave
the name as default, and click OK.
Figure 2-9. Running the
DemoFigure 2-10. Import Atmel Start
Project
Info: Note the .atzip
is in the downloads directory, while the project directory is your default
Studio 7 project directory.
Tip: You can also
drag and drop the .atzip onto Atmel Studio 7, to open the
Import Atmel Start Project wizard.
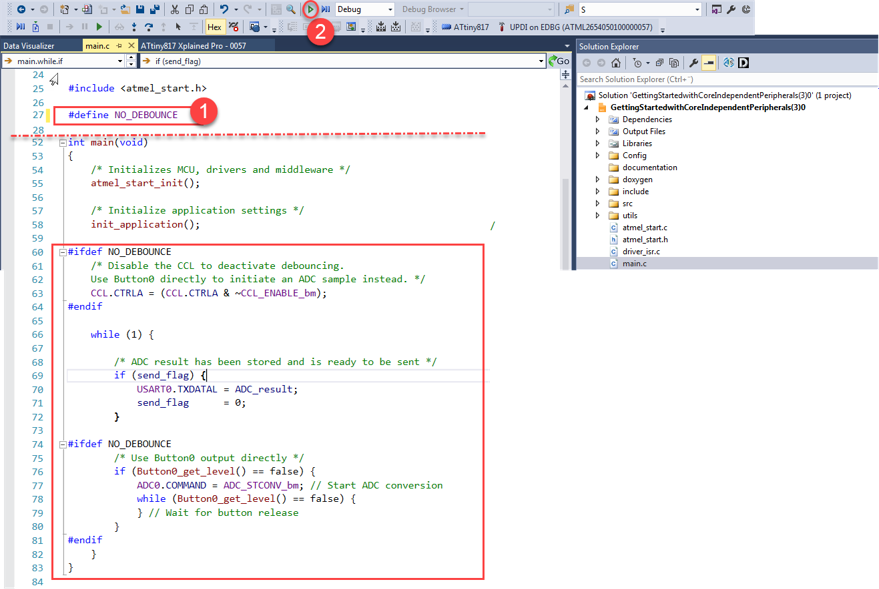
Todo: Once the project is imported,
double-click ‘main.c’ to view the project entry point; this is shown
in the figure below.
Todo: Follow step 3.
Todo: Click the
Tool icon (), and select the Debugger/Programmer kit.
Result: A debug tool is associated
with the project. We will do the programing step, after connecting and
configuring the Data Visualizer.
Todo: Follow steps 4, 5, and
6.
We have reached a stage to view the output via the Data
Visualizer.
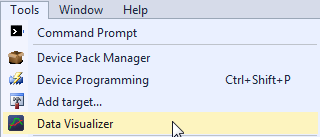
Todo: Configure
the Data Visualizer
Open the Data
Visualizer from the Tools > Data Visualizer menu.
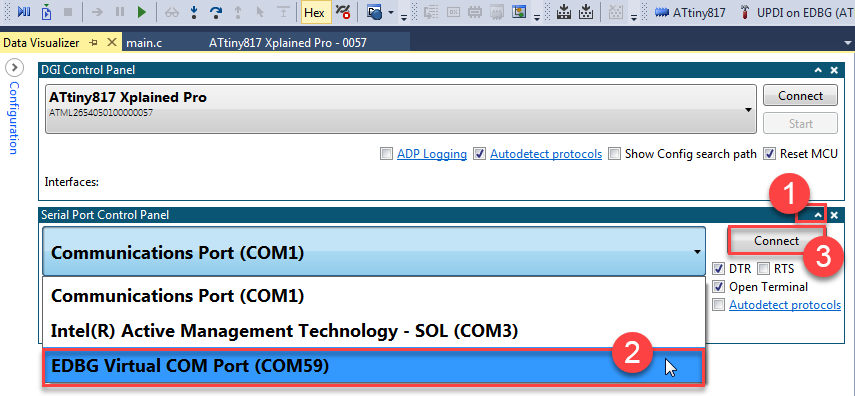
Click to expand the
Serial Port Control Panel
Select the
EDBG Virtual COM Port (COMxx)
Check the Open
Terminal check box if not selected, then click
Connect.
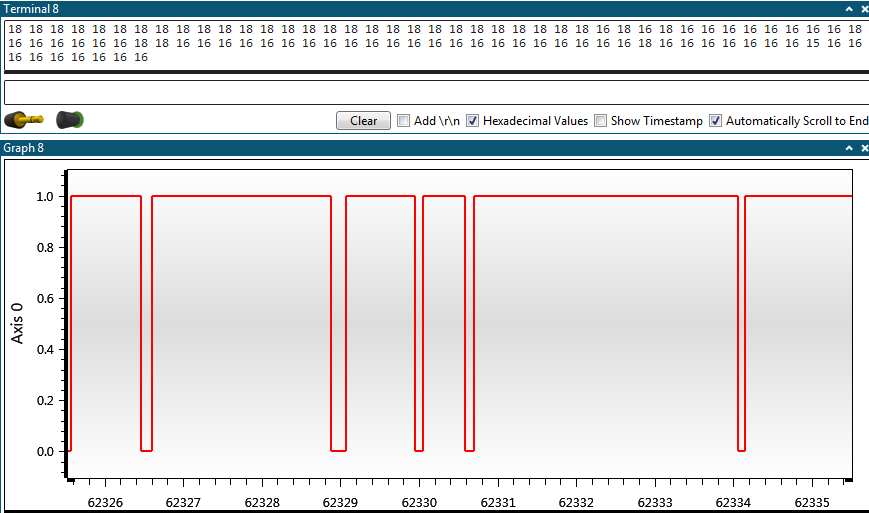
Check
Hexadecimal Values to see the ADC conversion
results are displayed on the terminal.
Click Start
Without Debugging (Ctrl+Atl+F5) to
program and run the project.
Result: For every button press,
exactly one hexadecimal result should be displayed on the Data
Visualizer.
Info: Note that the intro section
of the example user guide described how to remove the Custom Logic based
switch debouncing, by toggling off the comment:
//#define NO_DEBOUNCE
Todo: Toggle-off this comment, then
program again
Result: The CCL based switch bounce
has now been removed. You may now notice that on occasion two HEX value pop-
up per button click, i.e. since two ADC samples were taken.
Further Visualization
In the first part of this lab we enabled and disabled switch debouncing
using the Configurable Logic Control (CLC) block. Let’s have a look and what is
happening on the pin, using the Data Visualizer.
See the below extract from the ATtiny817 Xplained Pro schematic.
Note that DGI GPIO channels are connected to PB5 and PB6 (and that PB5 happens to be
SW0). Looking at the USER_BUTTON (SW0), note that there are no pull-ups on this
pin.
Before adding a graph to the Data Visualizer, let’s make some space.
Tip: On the Xplained Pro, the
Data Gateway Interface (DGI) are channels of the Embedded
Debugger (EDBG) that are always looking for data. All that is needed,
is to connect and visualize.
Todo: Minimize the Serial Port
Control Panel and re-size the terminal window, as shown in the image
below.
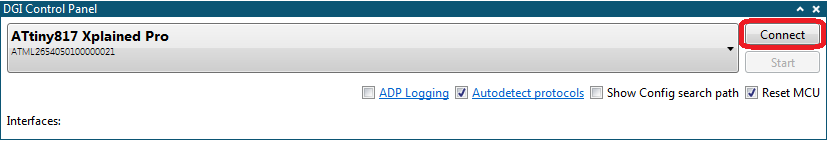
Todo: Click
Connect on the DGI Control Panel.
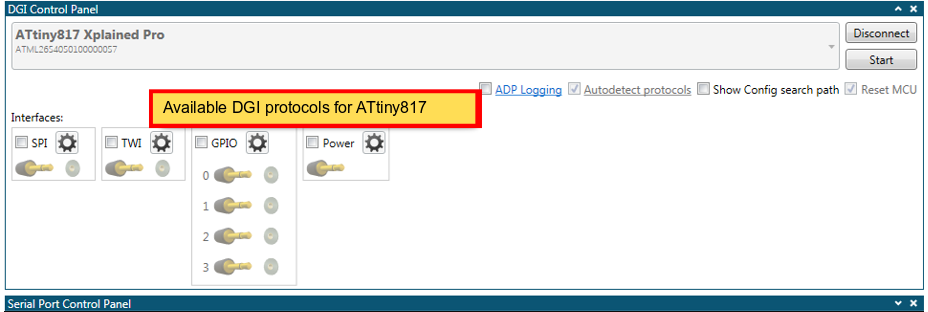
Result:
You will see the visualizer searching for protocols. Then you
will see the following results: SPI, TWI (I2C), GPIO and Power.
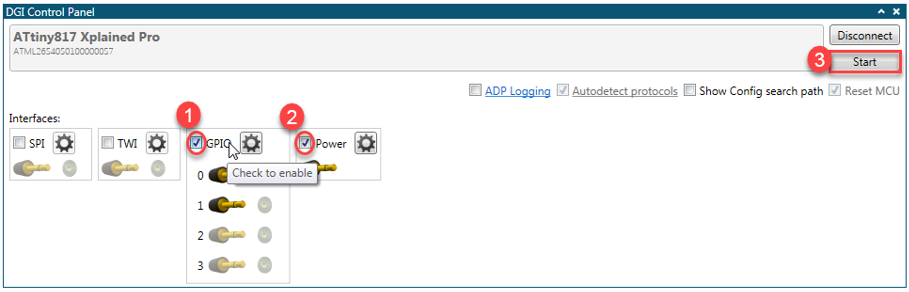
Todo:
Check
GPIO
and
Power check boxes
Click
Start
Result:
The DGI GPIO and Power are visualized on a single graph.
Power drawn by board (and LED) is shown if the jumper is set to
measure I/O (jumper closest to the switch side of the
board).
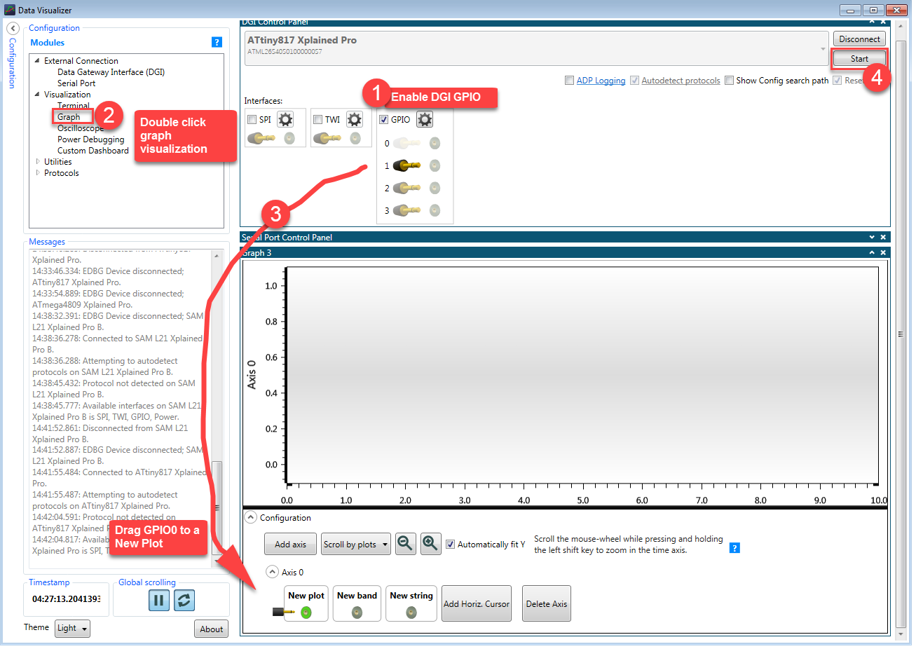
Next let’s put DGI
GPIO0 on a higher resolution graph.
Todo: Close the
Power Analysis window, using the
x in the top right of the window. Then, following
the image below:
Enable the
DGI GPIO check box (if not already
enabled)
Double click to add a
graph
Drag the GPI GPIO0
onto a new plot
Click
Start
Result:
You now see what is happening on the pin along with the ADC
samples received in the terminal.
LAB 1 Summary
We have now demonstrated the general process of running Atmel START
example projects, as well as covering some of the Data Visualizer basics. Example
projects may form a key component of your START based development process,
especially once you learn to re-configure projects in LAB3. However, let’s first
learn how to create new projects from scratch using Atmel START.
The online versions of the documents are provided as a courtesy. Verify all content and data in the device’s PDF documentation found on the device product page.

 where each symbol carries its own annotations to meet our application
requirements. The project can be further filtered by adding “Custom
Logic” into the free text search, “Getting
Started” to the category search and “ATTiny817
Xplained Pro” to the board search.
where each symbol carries its own annotations to meet our application
requirements. The project can be further filtered by adding “Custom
Logic” into the free text search, “Getting
Started” to the category search and “ATTiny817
Xplained Pro” to the board search.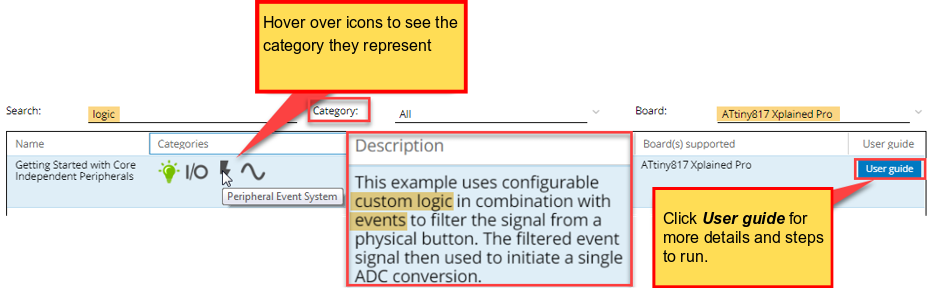
 Result: The project is created in Atmel START and you now have access to the DASHBOARD view:
 Getting Started category have links to training
materials, while the application notes category project have links to
application notes.
Getting Started category have links to training
materials, while the application notes category project have links to
application notes.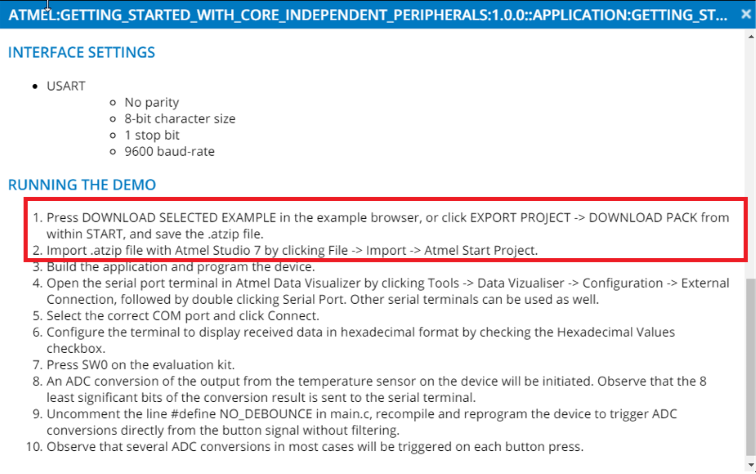
 Info: Note the .atzip is in the downloads directory, while the project directory is your default Studio 7 project directory.Tip: You can also drag and drop the .atzip onto Atmel Studio 7, to open the Import Atmel Start Project wizard.
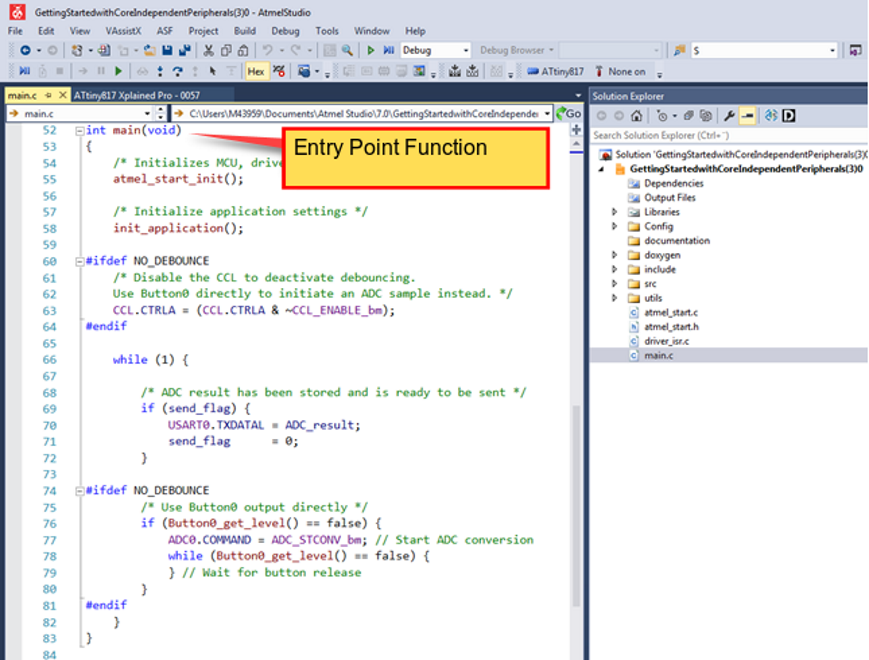
 ), and select the Debugger/Programmer kit.
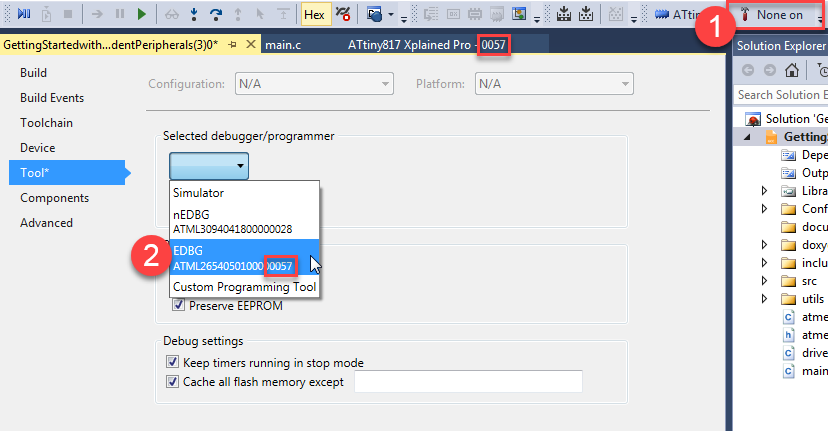 Result: A debug tool is associated with the project. We will do the programing step, after connecting and configuring the Data Visualizer.
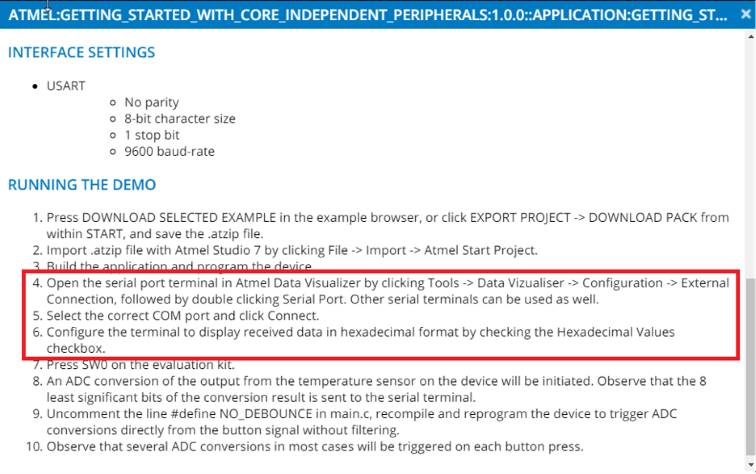
 (Ctrl+Atl+F5) to
program and run the project.
(Ctrl+Atl+F5) to
program and run the project.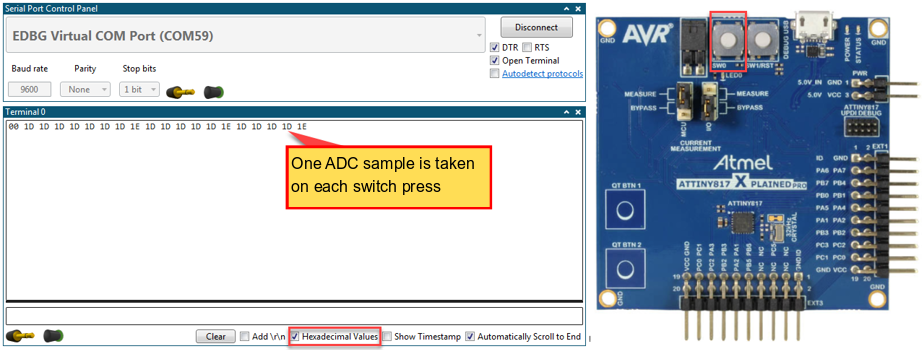 Result: For every button press, exactly one hexadecimal result should be displayed on the Data Visualizer.Info: Note that the intro section of the example user guide described how to remove the Custom Logic based switch debouncing, by toggling off the comment:
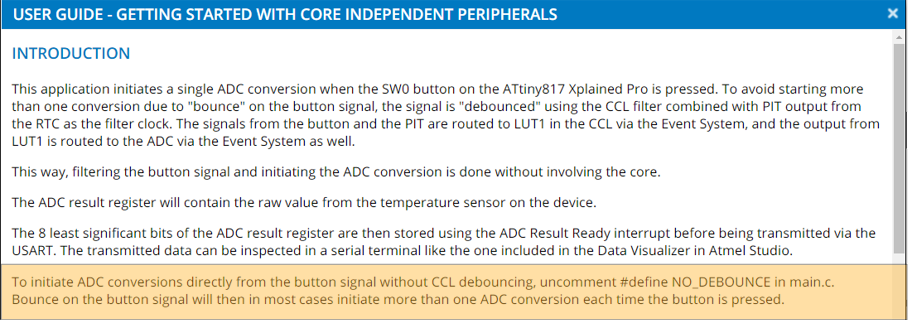
 Result: The CCL based switch bounce has now been removed. You may now notice that on occasion two HEX value pop- up per button click, i.e. since two ADC samples were taken.
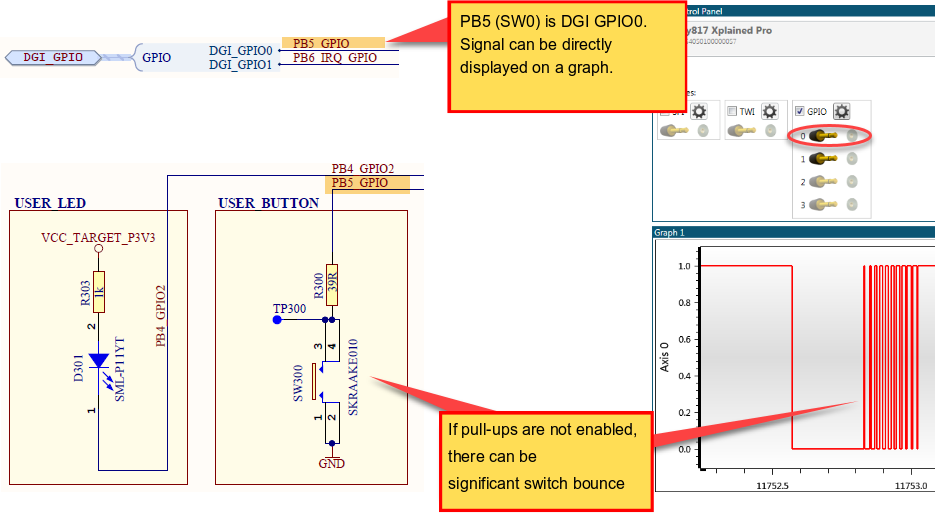

 Result:
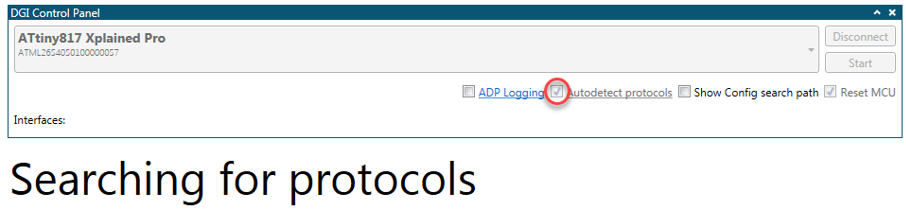
 Result:
 Result: