
9.2 Saving Already Captured Data
The snapshot function of the time plot supports selecting and exporting a range of data that has already been captured. The data snapshot can be output to a text file in CSV or JSON format. To capture the plot data, use the Mark Range and Save Snapshot buttons in the time plot toolbar. The Save Snapshot button will be disabled when there are no sources plotted.
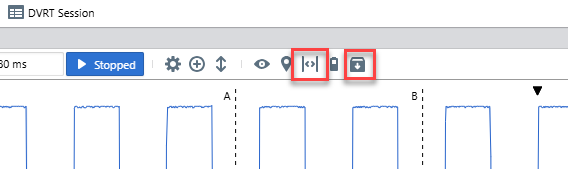
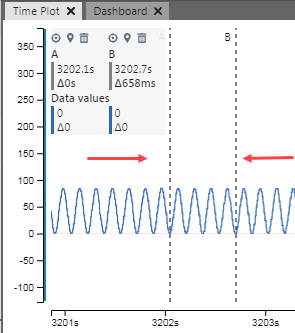
To capture a snapshot of plot data, first click on Mark to halt plot scrolling and set cursors (A and B) to mark a range in the plot window. The marked range will cover about 70 per cent of the visible plot. Adjust the cursors as desired, as shown in the figure.
Then click Snapshot to open the Snapshot wizard to select data and format output.
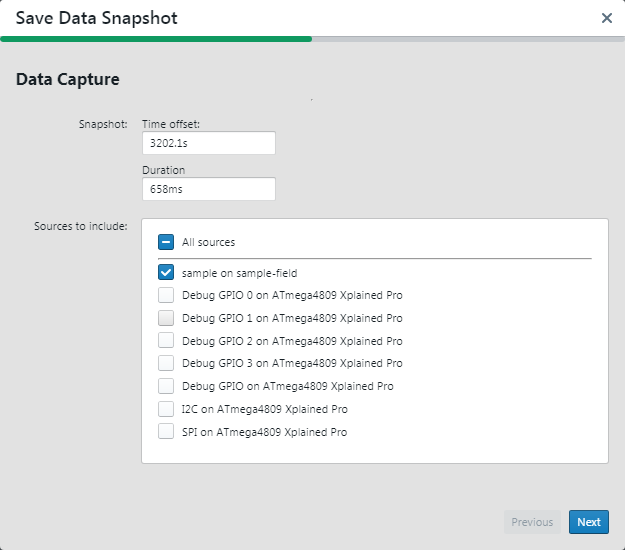
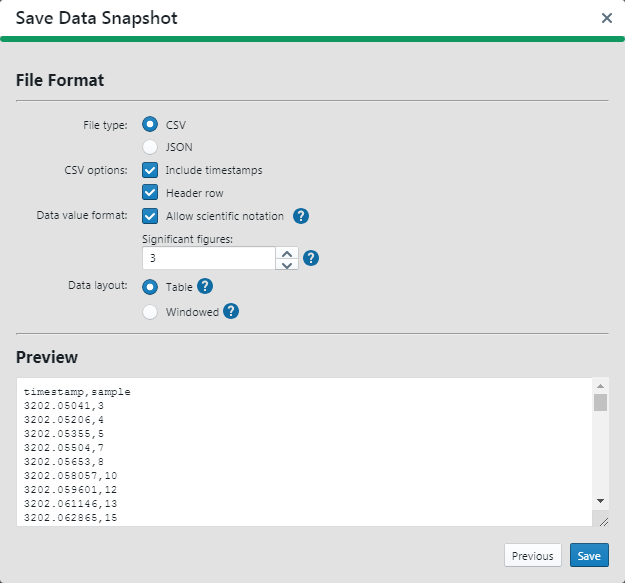
Select one available output file type. Other options are determined by this selection. To learn more about each option, hover over the question mark icon next to the option for a tooltip.
The Preview window will show you the result of selections made. When you are done, click Save. By default the file is saved to your User directory.