
2.2.5.4 Demo LCD Display
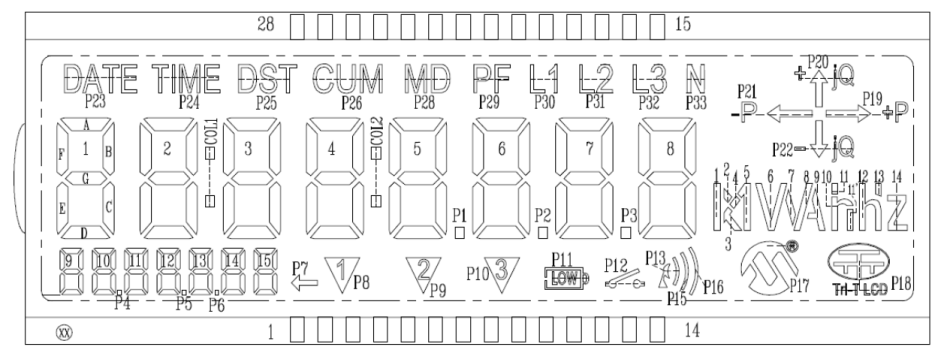
The Demo boards include an LCD customized for a smart metering application measurements. This LCD is driven directly by the PIC32CXMTC MCU, generating the driving signals for the common lines and the segments. The LCD layout is shown below.
The Multichannel Meter application periodically updates the display, showing different information in a loop. The user can manually switch the display content by pressing the Scroll-up and Scroll-down buttons.
The information displayed is managed by the application, and the typical parameters shown are summarized in the following table.
| Info Type | Display Content | Info Type | Display Content |
|---|---|---|---|
| 00 | Display All | 12 | Channel 2 RMS value |
| 01 | Board information | 13 | Channel 3 RMS value |
| 02 | Firmware Version | 14 | Channel 4 RMS value |
| 03 | Total active energy | 15 | Channel 5 RMS value |
| 04 | TOU1 active energy | 16 | Channel 6 RMS value |
| 05 | TOU2 active energy | 17 | Channel 7 RMS value |
| 06 | TOU3 active energy | 18 | Total maximum demand |
| 07 | TOU4 active energy | 19 | TOU1 maximum demand |
| 08 | RTC time | 20 | TOU2 maximum demand |
| 09 | RTC date | 21 | TOU3 maximum demand |
| 10 | Channel 0 RMS value | 22 | TOU4 maximum demand |
| 11 | Channel 1 RMS value | -- | -- |
The Multichannel Meter application switches on all the display elements when the system is powered on. Then, it shows the board information and the firmware version. Finally, the remaining information in the table is cyclically displayed if applicable.
The display includes specific icons for a smart metering application, to make the data visualization easier for the user.