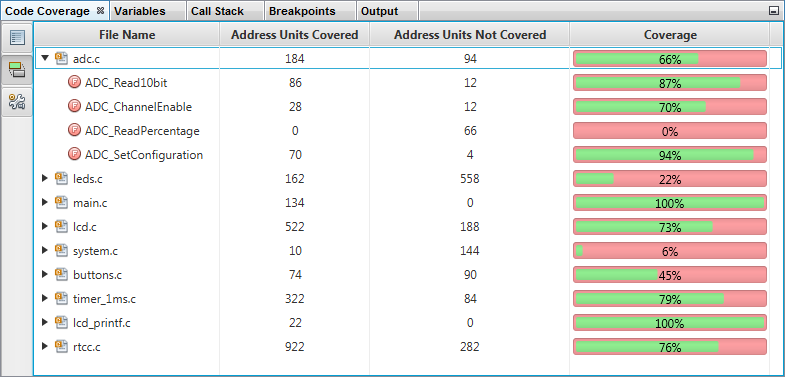
2.7.1.2 Code Coverage Window
To open the Code Coverage window, select Windows>Debugging>Code Coverage. This window shows you how successful your test code was at covering your application code.
When program execution is halted, the current coverage percentages for each file in the application will be shown. Click on the arrow to see a breakdown of coverage for functions in the file.
Coverage is expressed in Address Units, where an Address Unit represent the atomic unit of memory addressable by the execution portion of the project device architecture.
The Coverage percentage (in green) represents x/(x+y), where x = address units covered and y = address units not covered.

