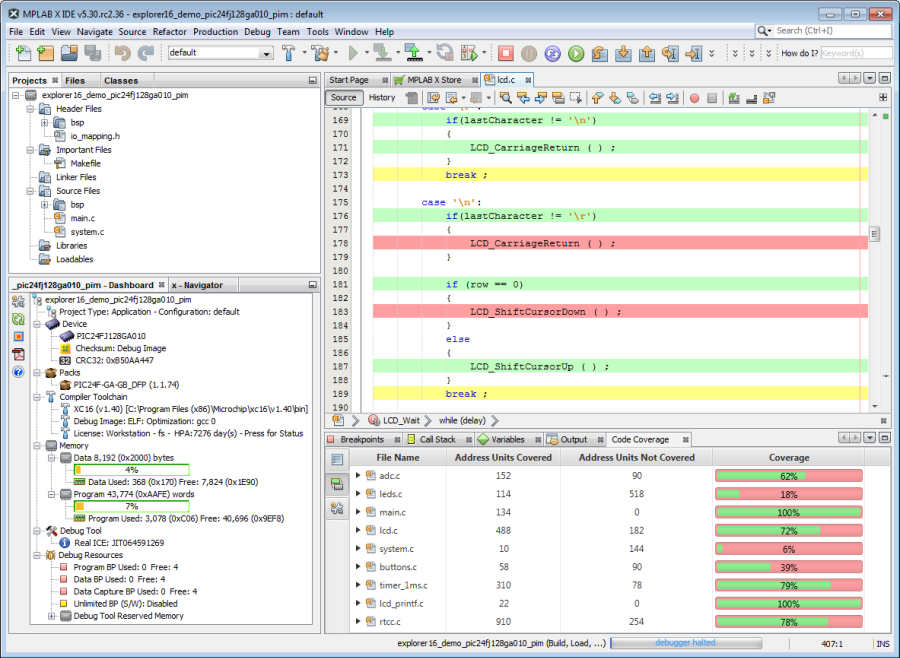
2.1 Code Coverage Overview
The Code Coverage feature in the MPLAB® Analysis Tool Suite provides visibility as to what portions of your code are being executed. Run your test cases to completion for a visual display of coverage. See [AoU-09-COV].
The Code Coverage feature requires the following tools:
- MPLAB X IDE v6.00 or later, which supports the display of code coverage data from an MPLAB XC C compiler with the MPLAB Analysis Tool Suite license. See [AoU-04-COV].
- The MPLAB Analysis Tool Suite license, which includes Code Coverage, (see Licenses for MPLAB® Analysis Tool Suite) that provides visibility as to what portions of your code are being executed. See [AoU-05-COV].
- An MPLAB XC C compiler, either Free or PRO, that supports code coverage output, specifically the versions in Licenses for MPLAB XC C Compilers. See [AoU-02-COV].
Note: This manual is written for MPLAB X IDE v6.00 or later.
Note: Use MPLAB X IDE
for the best code coverage experience.
Code coverage is displayed in the MPLAB X IDE as:
- Editor text highlighted by colors representing coverage: green = executed, yellow = partially executed, and red = not executed.
- Program memory highlighted by colors representing coverage.
- A Code Coverage tab with a report displaying color percentages of code covered. This information may be written to an HTML Report for later viewing.


