2.6 View Code Coverage Output
After you have enabled code coverage, as described in Enable/Disable Code Coverage, debug your code and execute all test cases to completion. Once complete, halt execution either automatically or manually and step as needed till all code execution is complete.
To view code coverage:
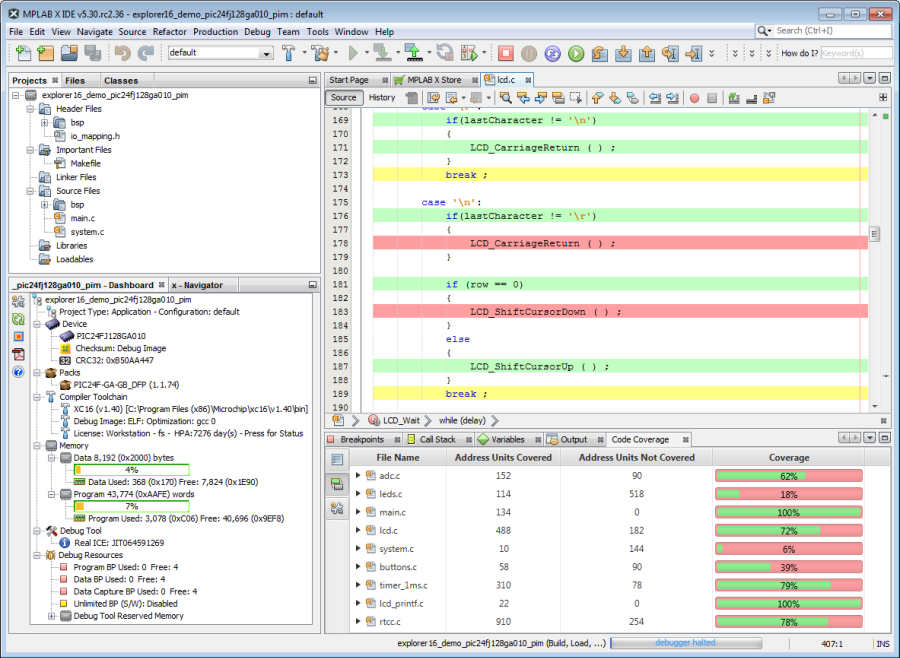
- Right click on the project name and select “Show Code Coverage Summary” or select Window>Debugging>Code Coverage.
- To see highlight in Editor window you may need to click in it. Covered code will be highlighted in the window.
- To see highlight in Program (or Execution) Memory window, open it under Windows>Target Memory Views. Covered instructions will be highlighted in the window.
- A summary report will be shown in the Code Coverage tab.

Highlight Colors
The meaning of highlight colors in the Editor window and Program or Execution Memory window are described in the table below.
| Highlight Color | Highlight Name | Meaning |
|---|---|---|
 | Green | Covered and Executed |
 | Yellow | Covered and Partially Executed (Editor window only) |
 | Red | Covered but not Executed |
| No Color | No coverage information generated1 | |
Note 1: Reasons why
no coverage information would be generated include:
There may be other circumstances that C source lines do not produce executable code. See the examples in Understand Code Coverage Output. | ||
Coverage Colors
On the Code Coverage tab, the colors on the bar chart under “Coverage” have the following meanings:
| Coverage Color | Coverage Name | Meaning |
|---|---|---|
 | Green | Total code covered and executed by test suite(s). |
 | Red | Total code covered by test suite(s). |
For more on this tab, see Code Coverage Window.
Code Coverage Tab Buttons
Click on buttons in the gutter of this tab for the following functions.
 | Generate HTML Report. This report will show the same data presented in the Code Coverage window. |
 | Toggle (enable/disable) color highlighting in editor window. |
 | Open Project Properties to enable/disable code coverage. |
