
5.2 Graph With ADC Reference 5V
Note: The jumper position on HPC needs to
be selected to configure VDD = 5V and the input signal from Signal & Noise
Generator is
2.5V
The Data Visualizer graph with VDD = 5V and ADC input signal VDD/2= 2.5V is as shown in Figure 5-4. The red colored signal is the noisy input signal (ADRES value), the green colored signal is the filtered signal (ADFLTR value).
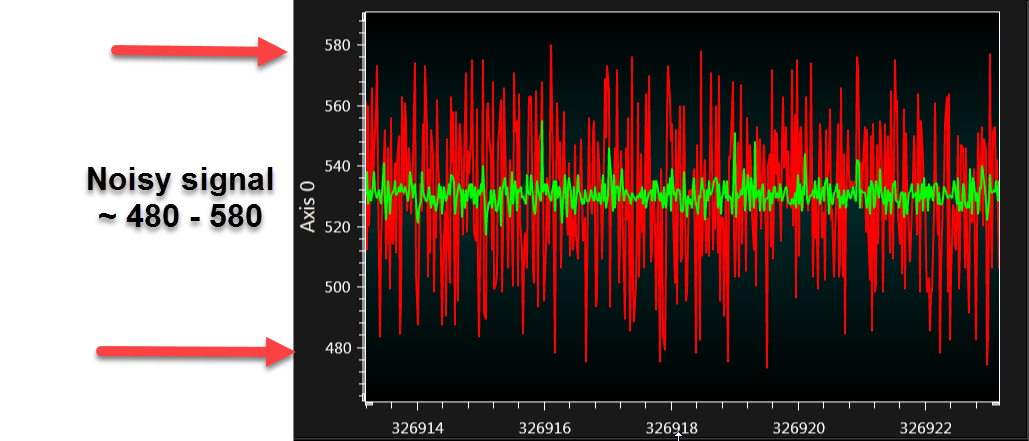
From the graph, it can be seen that the ADC count value for a non-filtered signal (noisy input signal) is ~ 480 - 580.
A zoomed in signal is illustrated in Figure 5-5.
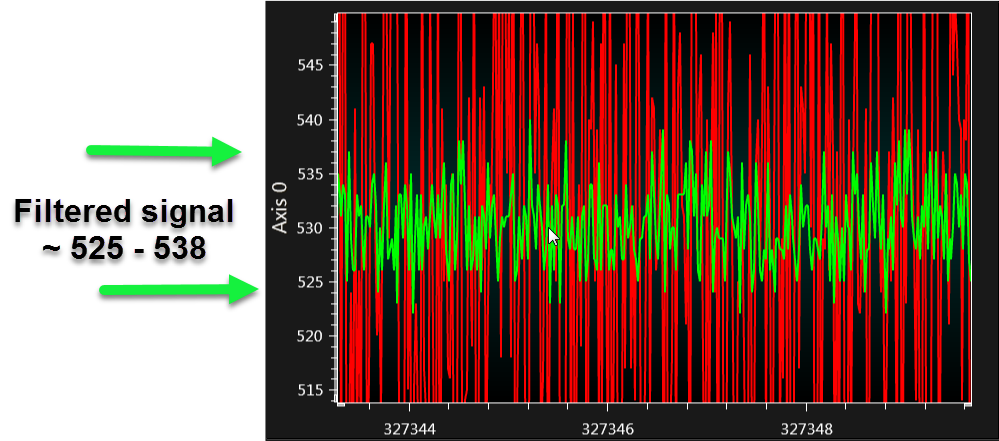
It can be seen from Figure 5-5 that the ADC count value for a filtered signal is ~525 - 538.
A noise level comparison table is as shown in Table 5-1.
| ADC Reference 3.3V | ADC Reference 5V | |
|---|---|---|
| ADC count NON filtered | 440 - 580 | 480 - 580 |
| Noise count NON Filtered | 140 | 100 |
| ADC count Filtered | 512 - 532 | 525 - 538 |
| Noise Count Filtered | 20 | 13 |
A signal with 5V ADC reference shows less noise count than 3.3V ADC reference.