
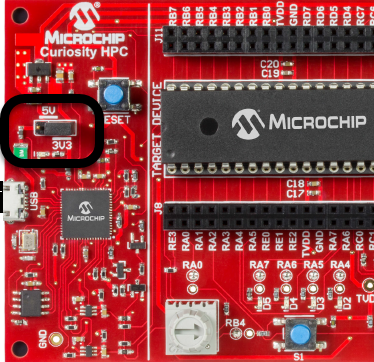
5.1 Graph With ADC Reference 3.3V
The Data Visualizer graph with VDD = 3.3V and ADC input signal VDD/2 = 1.65V is as shown in Figure 5-2. The red colored signal is the noisy input signal (ADRES value), the green colored signal is the filtered signal (ADFLTR value).
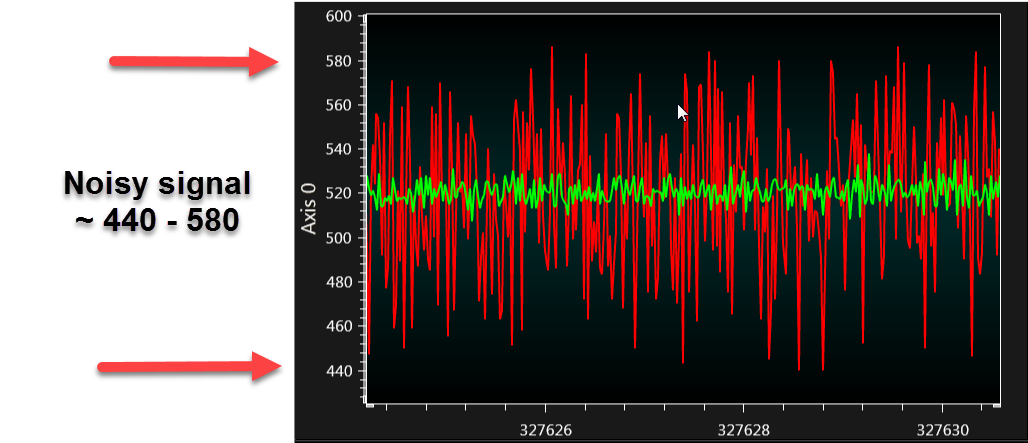
From the graph, it can be seen that the ADC count value for a non-filtered signal (noisy input signal) is ~ 440 - 580.
If the signal is zoomed in, it is illustrated in Figure 5-3.
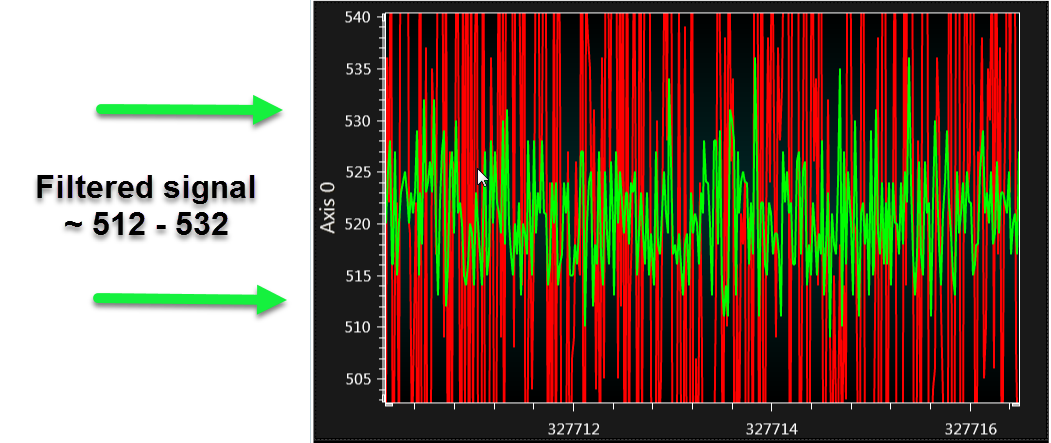
It can be seen from Figure 5-3 that the ADC count value for the filtered signal is ~ 512 - 532.